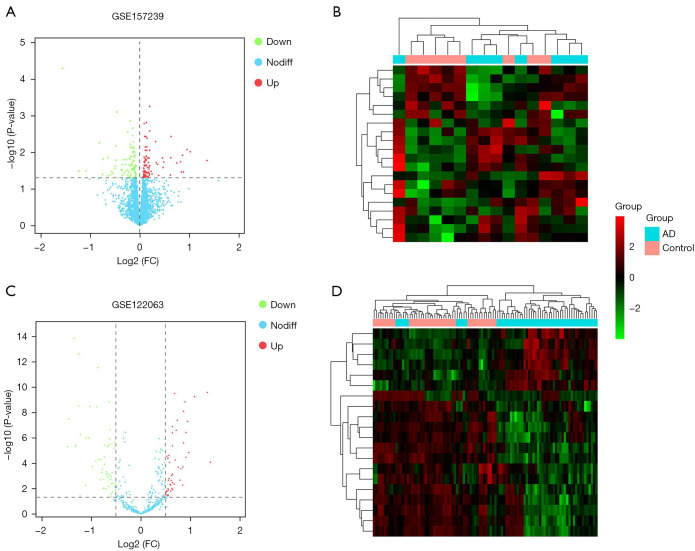
Figure 2.
Volcano maps and cluster maps. (A) A volcano map showing the differentially expressed microRNAs (miRNAs) in AD. Red represents the upregulated genes, green represents the downregulated genes, and blue represents genes that were not significantly differentially expressed. (B) A cluster map of the differentially expressed miRNAs. (C) A volcano map of the differentially expressed long non-coding RNAs (lncRNAs) in AD. Red represents the upregulated genes, green represents the downregulated genes, and blue represents genes that were not significantly differentially expressed. (D) A cluster map of the differentially expressed lncRNAs. AD, Alzheimer’s disease.

