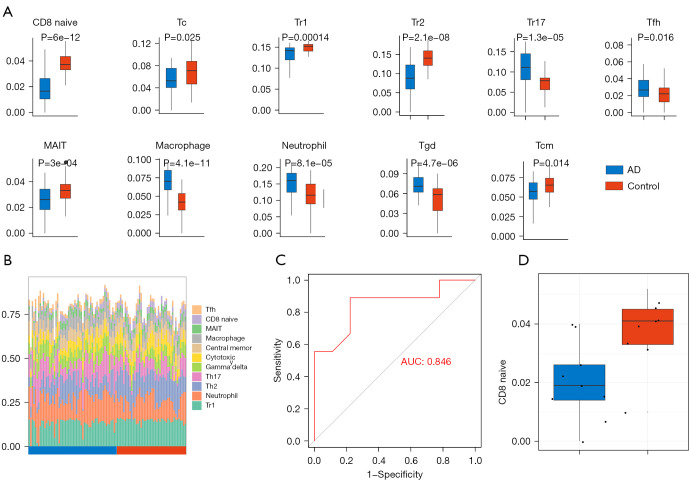
Figure 6.
Immune infiltration analysis. (A) The immune cell types that are differentially expressed in AD samples and control samples are shown. (B) The abundance of the differentially expressed immune cells in the samples. (C) The receiver operating characteristic (ROC) curve was used to verify the expression of naïve CD8 cells in the GSE150696 dataset. (D) The Immune infiltration score of CD8 cells in AD group and control group. AD, Alzheimer’s disease.

