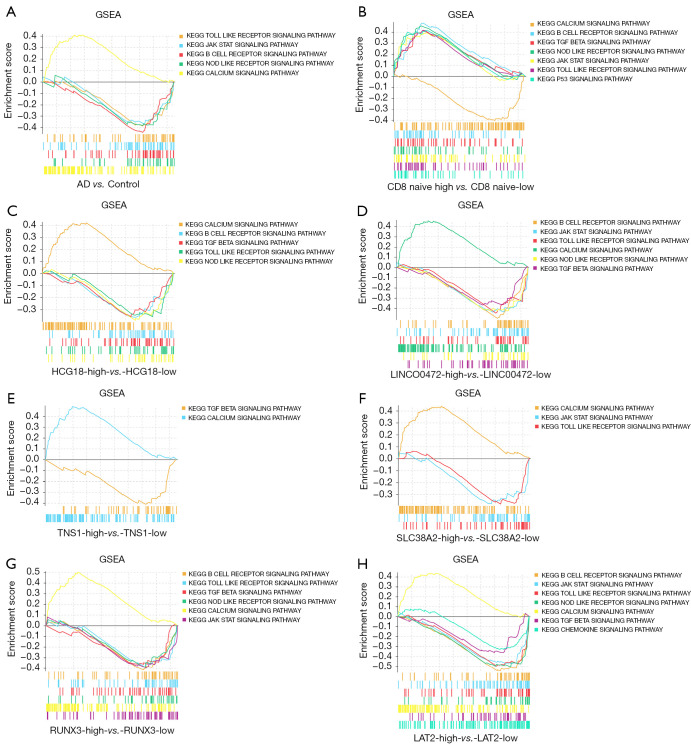
Figure 8.
The results of the GSEA enrichment analysis. (A) AD samples compared to control samples. (B) High expression of naïve CD8 cells compared to low expression of naïve CD8 cells. (C) High expression of HCG18 compared to low expression of HCG18. (D) High expression of LINC00472 compared to low expression of LINC00472. (E) High expression of TNS1 compared to low expression of TNS1. (F) High expression of SLC38A2 compared to low expression of SLC38A2. (G) High expression of RUNX3 compared to low expression of RUNX3. (H) High expression of LAT2 compared to low expression of LAT2. AD, Alzheimer’s disease; GSEA, gene set enrichment analysis; HCG18, HLA complex group 18; LINC00472, long intergenic non-protein coding RNA 472; TNS1, TNS1, tensionin 1; SLC38A2, solute carrier family 38 member 2; RUNX3, RUNX family transcription factor 3; LAT2, linker for activation of T cells family member 2.

