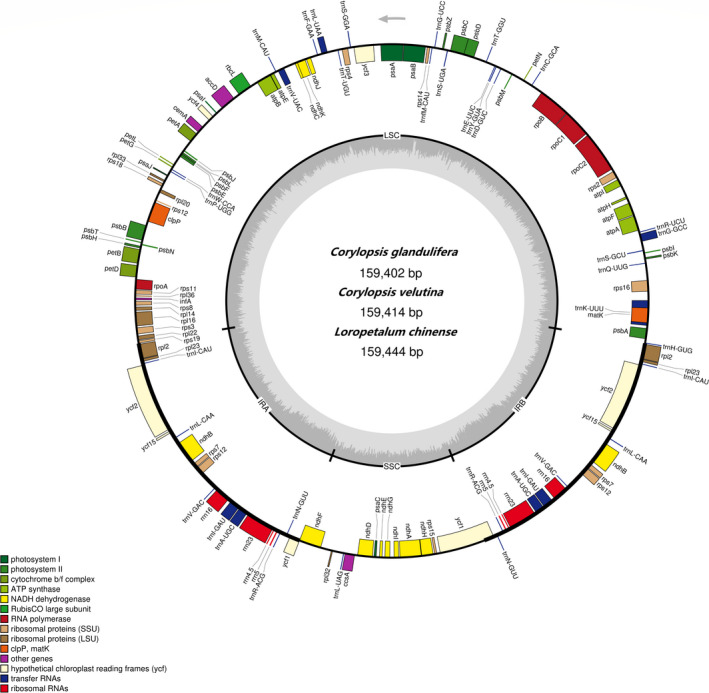
FIGURE 1.

The chloroplast genome maps of Corylopsis glandulifera, Corylopsis velutina, and Loropetalum chinense. Genes on the inside of the circle are transcribed clockwise and those on the outside are transcribed counter‐clockwise. The darker gray inner circle corresponds to the GC content, whereas the lighter gray indicates the AT content. Different colors represent different functional genes
