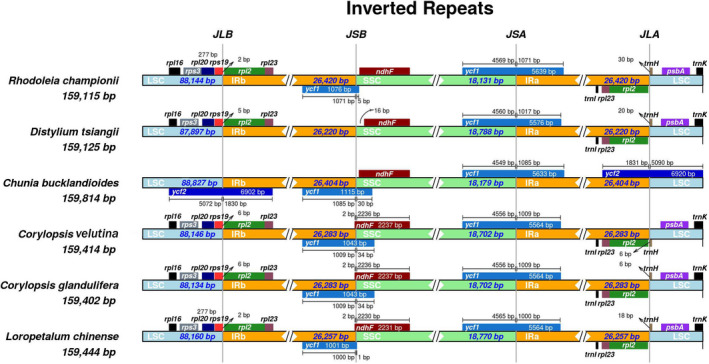
FIGURE 7.

Comparison of the borders of the large single‐copy (LSC), small single‐copy (SSC), and inverted repeat (IR) regions among the six Hamamelidaceae chloroplast genomes. Genes are denoted by colored boxes. The gaps between the genes and the boundaries are indicated by the base lengths (bp)
