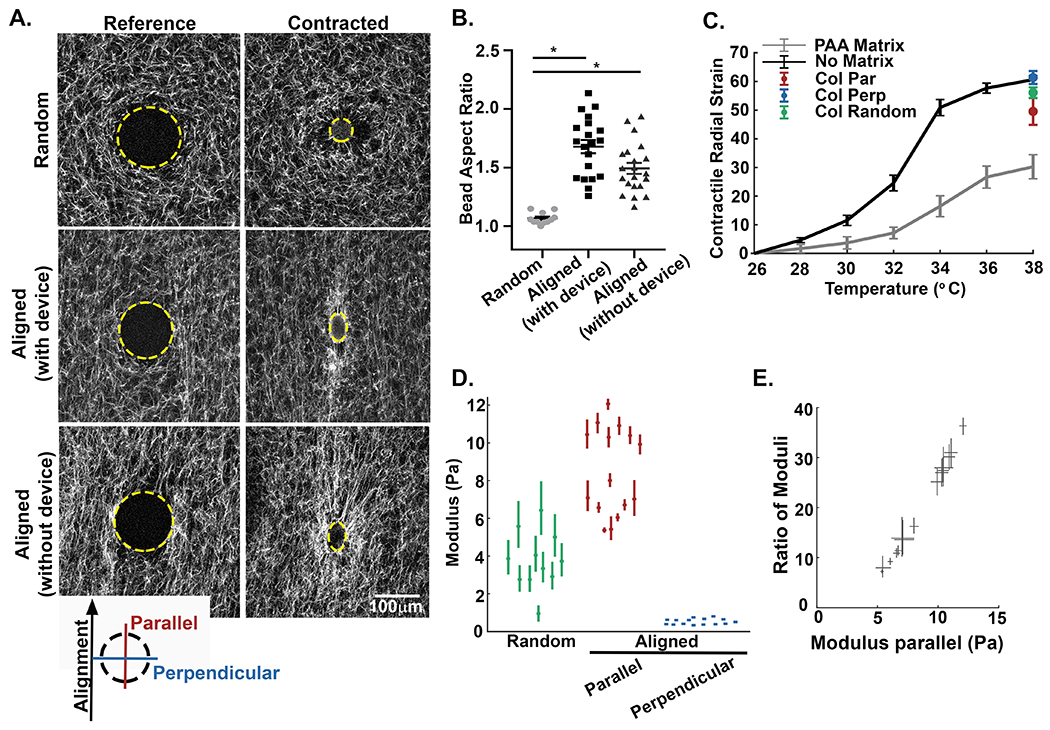
Figure 3: The alignment of collagen fibers creates local anisotropy in the cell-scale modulus.

A) Alexa-488 collagen gels were seeded with inducible contractile pNIPAAm microspheres (edge of microsphere defined by yellow line) and strained to create fiber alignment. The inserted key denotes the orientation of parallel and perpendicular directions with respect to the fiber alignment. The pNIPAAm microsphere were then contracted to generate a localized displacement field. Alignment of collagen fibers results in the elongation of the spherical pNIPAAm microsphere during contraction. B) Quantification of microsphere aspect ratio for random (unstrained) matrices (n=27), aligned (strained) matrices with the straining device intact (n=12), and aligned (strained) matrices where the device was removed after straining (n=14). C) To calculate the local modulus in directions parallel and perpendicular to axis of the alignment, the bulk modulus of the pNIPAAm microspheres were calibrated to a known PAA matrix (n = 45 microspheres) and in no matrix (n = 30 microspheres). The average contraction of microspheres in random (green, n = 11 microspheres) and aligned (parallel to alignment, red; perpendicular to alignment, blue, n = 15 microspheres) matrices. Error bars indicate standard deviation. D) Plots of the directional modulus in random fiber network (green, n=11 microspheres) and in the parallel (red) and perpendicular (blue) directions in aligned collagen gels (n=15 microspheres). Means are reported with 95% confidence intervals representing uncertainty in the modulus measured by each microsphere. The data in random matrices is significantly different from aligned, in both parallel and perpendicular directions (p < 0.05 by Kruskal Wallis test with Dunn’s correction). For comparison between parallel and perpendicular directions, refer to panel E. E) Directional stiffness demonstrated by the relative ratio modulus parallel /perpendicular in aligned matrices plotted against the modulus parallel. Modulus in the direction of alignment is up to 30 to 35 times higher than the stiffness of the perpendicular axis. Width and height of each measurement correspond to the 95% confidence interval. As confidence intervals do not span 1, the modulus is statistically different between parallel and perpendicular directions.
