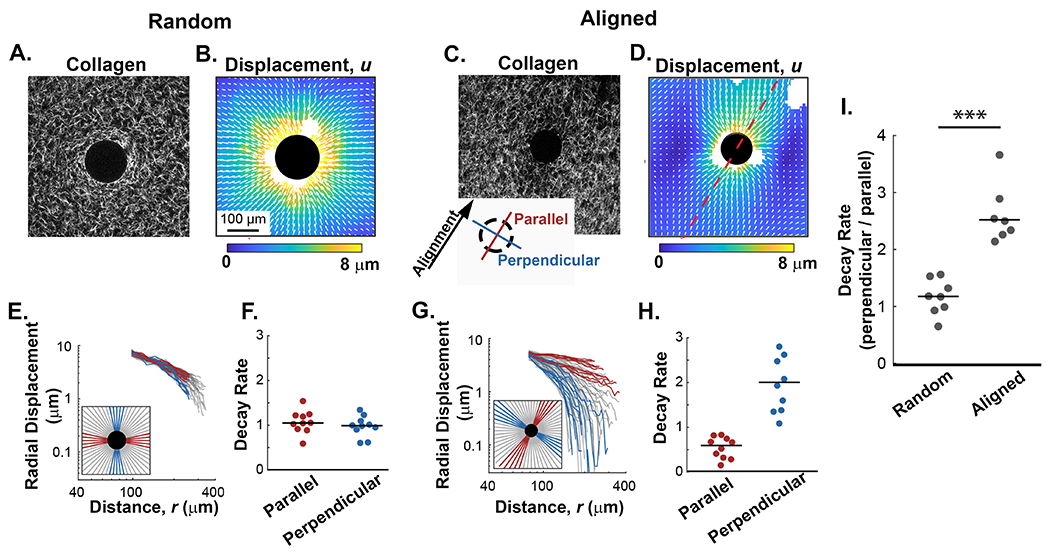
Figure 4: The alignment of collagen fibers imparts directionality to the propagation of contraction-induced fiber displacements.

A and B) Representative example of collagen fibers (SHG) and their corresponding fiber displacement map from random collagen gels after contraction of pNIPAAm microspheres. C and D) Representative example of fibers (SHG) and their corresponding fiber displacement map from contracted pNIPAAm microspheres in an aligned collagen gel. The axis of alignment is represented by the red dashed line. E and G) Radial traces were circumferentially extracted from the displacement plots and plotted against the distance from the contractile particle as described by the key located in the lower left corner of each plot. Red lines represent traces extracted along the axis of alignment while blue lines represent traces perpendicular to alignment. In random gel the axis of alignment is arbitrarily assigned. Gray lines represent non-orthogonal angles. F and H) Quantification of fiber displacement decay rates, n, from a representative microsphere for the parallel and perpendicular directions in random and aligned matrices, respectively. I) Quantification of n (decay rates) in directions parallel and perpendicular for microspheres in random (n=8 microspheres) and aligned (n=7 microspheres) collagen fiber architectures. Lines indicate medians; significance was determined with a Wilcoxon rank sum test (*** p < 0.001).
