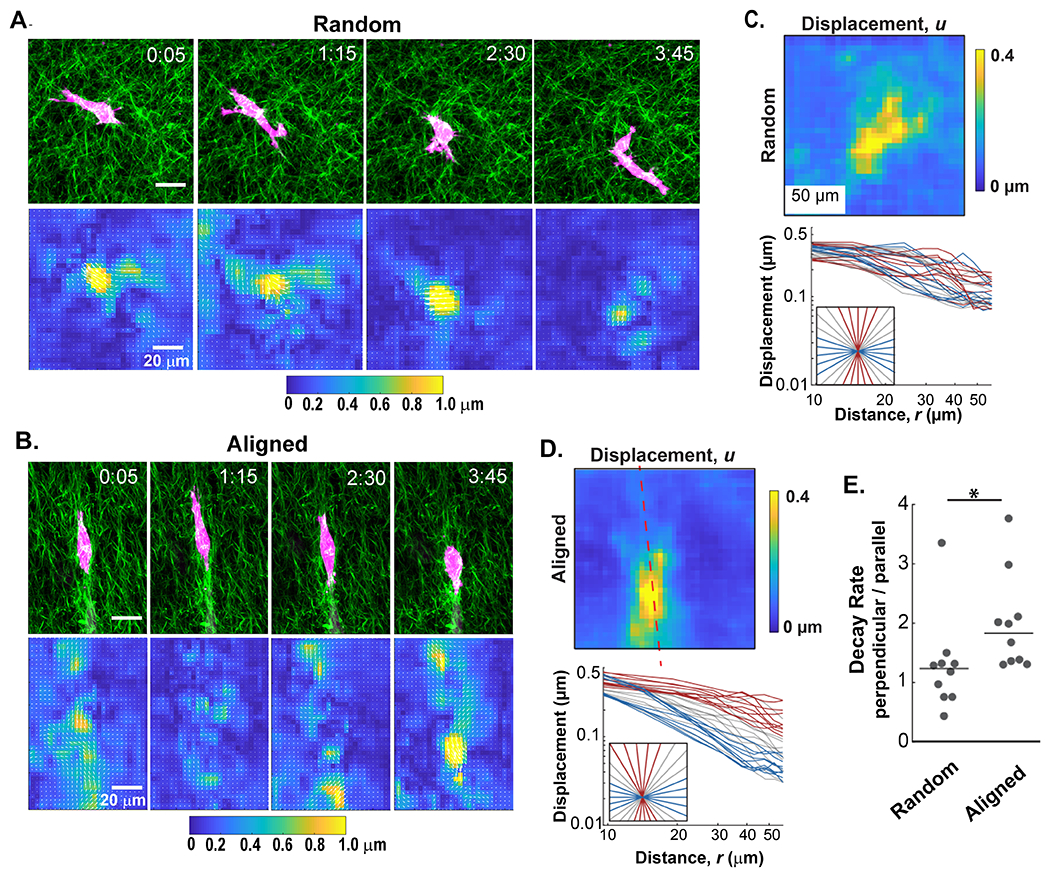
Figure 5: The alignment of collagen affects the propagation of cell-induced fiber displacements.

A and B) A 4 hour time course of GFP-LifeAct-MDA-MB-231 cells (red) migrating in collagen (SHG, green) gels exhibit different fiber displacement patterns in random and aligned matrices, respectively. C and D) Top panels: The fiber displacement was averaged over the 4 hour time course of cell migration for each collagen fiber architecture. Bottom panels: Graphs below each heatmap represent the radial traces extracted from the average fiber displacements plotted against the distance from the cell perimeter in random and aligned conditions. Red lines represent traces extracted along the axis of alignment while blue lines represent those that extend perpendicular. Gray lines represent non-orthogonal angles. E) Quantification of the ratio of decay rates in directions perpendicular and parallel (nperpendicular / nParallel) to fiber alignment from multiple cells (n=10 microspheres for each fiber architecture). (*p < 0.05 by Wilcoxon rank sum test)
