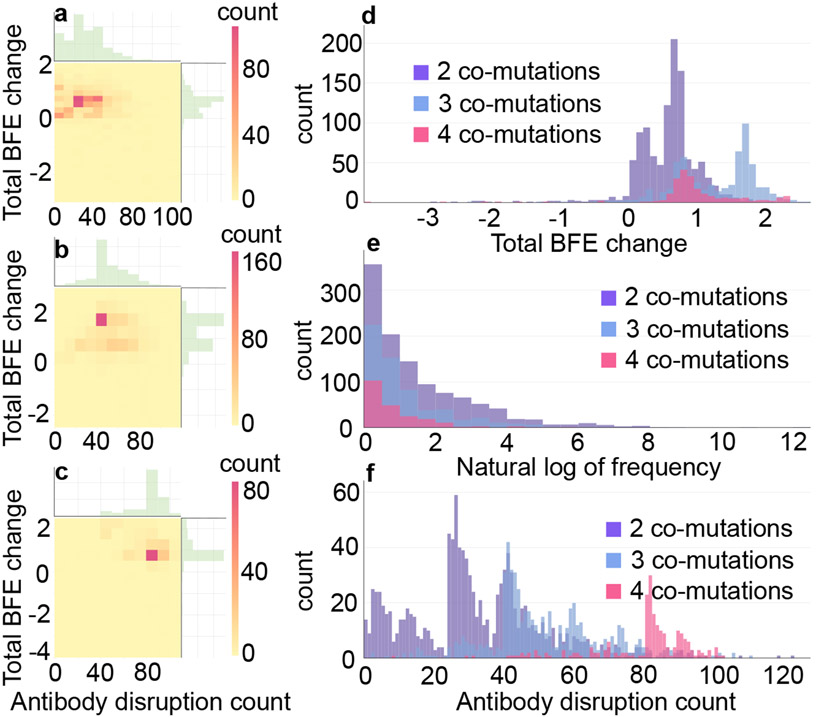
Figure 3:
a 2D histograms of antibody disruption count and total BFE changes for RBD 2 co-mutations (unit: kcal/mol). b 2D histograms of antibody disruption count and total BFE changes (unit: kcal/mol) for RBD 3 co-mutations. c 2D histograms of antibody disruption count and total BFE changes (unit: kcal/mol) for RBD 4 co-mutations. d The histograms of total BFE changes (unit: kcal/mol) for RBD co-mutations. e The histograms of the natural log of frequency for RBD co-mutations. f The histograms of antibody disruption count for RBD co-mutations. In figures a, b, and c, the color bar represents the number of co-mutations that fall into the restriction of -axis and -axis. The reader is referred to the web version of these plots in the Supporting Information S2.2.2 and S2.2.3.

