


Figure 4.
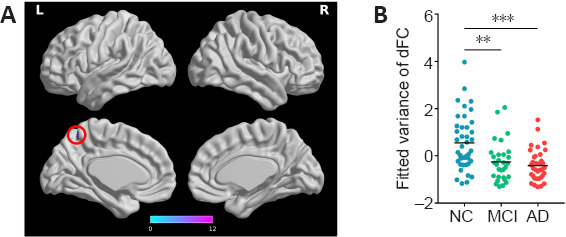
The difference in dFCS among the NC, aMCI, and AD groups.
(A) The voxel-based analysis revealed a difference in dFCS variance among the NC, aMCI, and AD groups in the left precuneus (red circle). (B) The NC group showed larger dFCS variance in the precuneus than the aMCI and AD groups. Data were analyzed using a two-tailed two-sample t-test. **P < 0.01; ***P < 0.001. AD: Alzheimer's disease; aMCI: amnestic mild cognitive impairment; dFCS: dynamic functional connectivity strength; L: left; NC: normal control R: right.