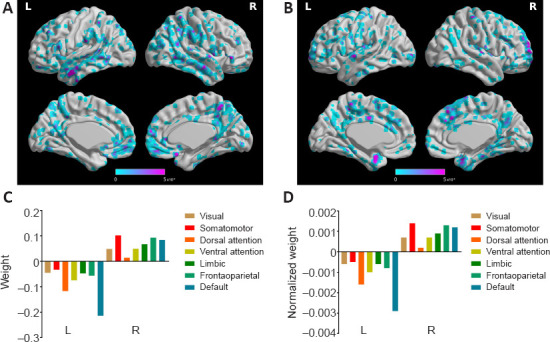
Figure 8.

The weight of classifying the AD from the NC group.
(A) The distribution of negative weight. (B) The distribution of positive weight. (C) The weight of different functional networks. (D) The normalized weight (by the volume of the functional network) of different functional weights. AD: Alzheimer's disease; L: left; NC: normal control; R; right.
