
Figure 2.
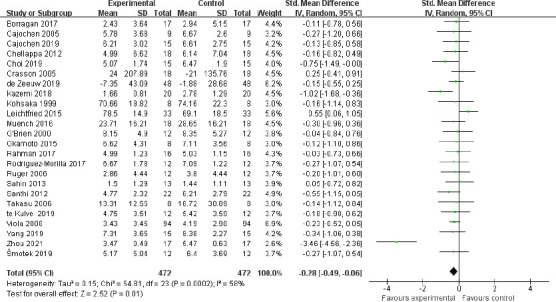
Meta-analysis of subjective alertness.
The forest plot was drawn from the effect sizes and 95% confidence intervals (CIs) of 24 independent studies using subjective scales. Each dash represents the 95% CI, and the green rectangle represents the standardized mean difference (SMD). The prismatic symbol at the bottom represents the comprehensive result of the included studies, which does not intersect with SMD = 0 and is on the left, indicating that the experimental intervention was significantly effective.