Fig. 4.
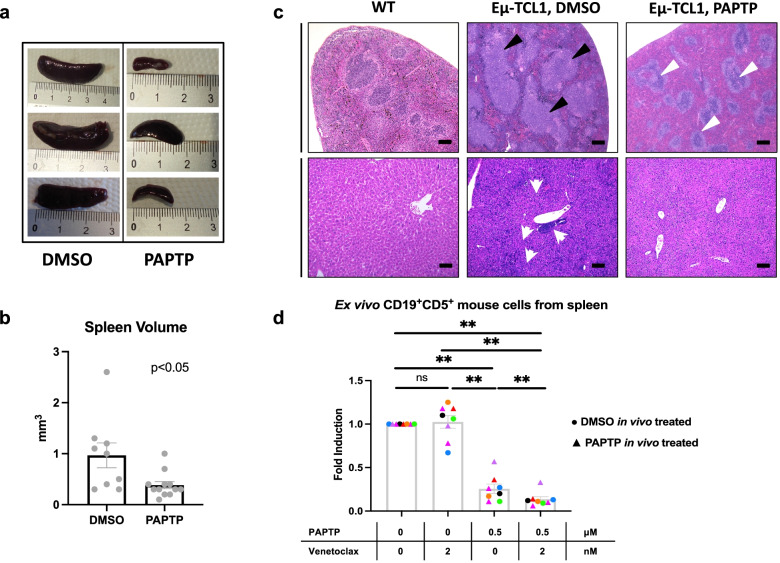
PAPTP reduces splenomegaly and ameliorates tissue morphology in Eμ-TCL1 mice. a Representative spleens from Eμ-TCL1 mice treated with DMSO or PAPTP. b Spleen volume of Eμ-TCL1 mice treated with DMSO or 5 nmol/g PAPTP. Data were obtained from 9 mice treated with DMSO and 12 mice treated with PAPTP. c Histological sections from spleen and liver samples of WT mice and from Eμ-TCL1 mice treated with DMSO or PAPTP were stained with hematoxylin and eosin. Spleen sections from Eμ-TCL1 mice treated with DMSO show large nodular lymphoid aggregates (black triangles), that are not visible in sections from mice treated with PAPTP, where normal follicles can be observed (white triangles). Liver sections from mice treated with DMSO disclosed a lymphoid infiltrate akin to that observed in the spleens, with small portal, intra-lobular and sinusoidal/interstitial growth pattern and occasional lymphoid aggregates of neoplastic cells (white arrowheads, please note a big neoplastic lymphocytic nodule in the center of the image). Intra-hepatic lymphocytes were scant to absent in both PAPTP-treated and control livers. Bar corresponds to 100 μm in all images. d Ex vivo spleen cells were extracted from the same Eμ-TCL1 mice injected with DMSO or with 5 nmol/g PAPTP shown in Fig. 3. The expression level of the channel did not change: mean fluorescence intensity was (398.75 ± 73.39 (SD) (n = 4) before treatment versus 423.25 ± 95.66 (SD) (n = 4) after treatment, p = 0.69, t-test (not shown). The cells were then treated with 0.5 μM PAPTP, 2 nM Venetoclax or with both, for 20 h. Percentages of dead pathological B (CD19+CD5+) CLL cells were assessed by flow cytometry (via Annexin staining) for each condition. Note that the color code is the same of that used in Fig. 3. Data are shown as fold induction of the control (untreated) and mean ± SEM values are depicted by histograms. Statistical significance of differences was assessed with the Wilcoxon test

