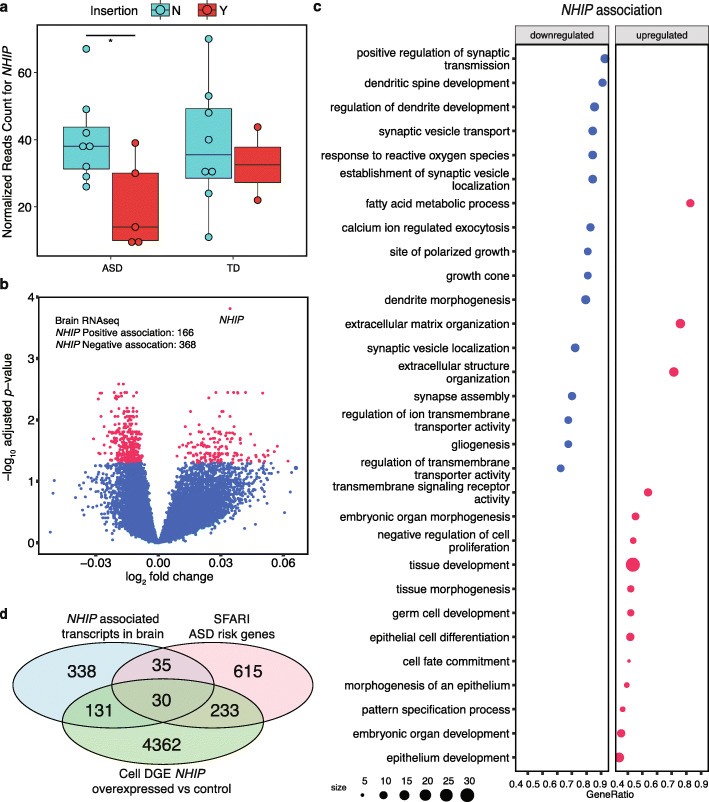
Fig. 4.
NHIP levels in brain are reduced in ASD and associated with expression of genes enriched for synaptic functions, response to oxidative stress, and ASD risk. A Brain samples homozygous for the 22q13.33 insertion had significantly lower NHIP levels compared to those who were not (p value = 0.048). The association between NHIP levels and the insertion was observed specifically in ASD (p value = 0.036), not in TD (p value = 0.711) (Mann-Whitney-Wilcoxon, brain, ASD n = 13, TD n = 10). B NHIP-associated differential expression analysis was performed from brain RNA-seq, adjusted for sex, age, brain region, and PMI, identifying 534 genome-wide significant genes (FDR-adjusted q-value < 0.05). C Gene ontology (GO) enrichment analysis of the 851 NHIP-associated genes in brain identified significantly enriched terms (FDR-adjusted q-value < 0.05). Positively associated GO terms are shown in red and negatively associated GO terms are colored in blue. D Venn diagram representing the 30 genes in common between NHIP association in brain (adjusted), differential gene expression (DGE) in the NHIP overexpressed cell line, and SFARI ASD risk genes. Genes are listed in Table 1 with common functional categories

