Fig. 3.
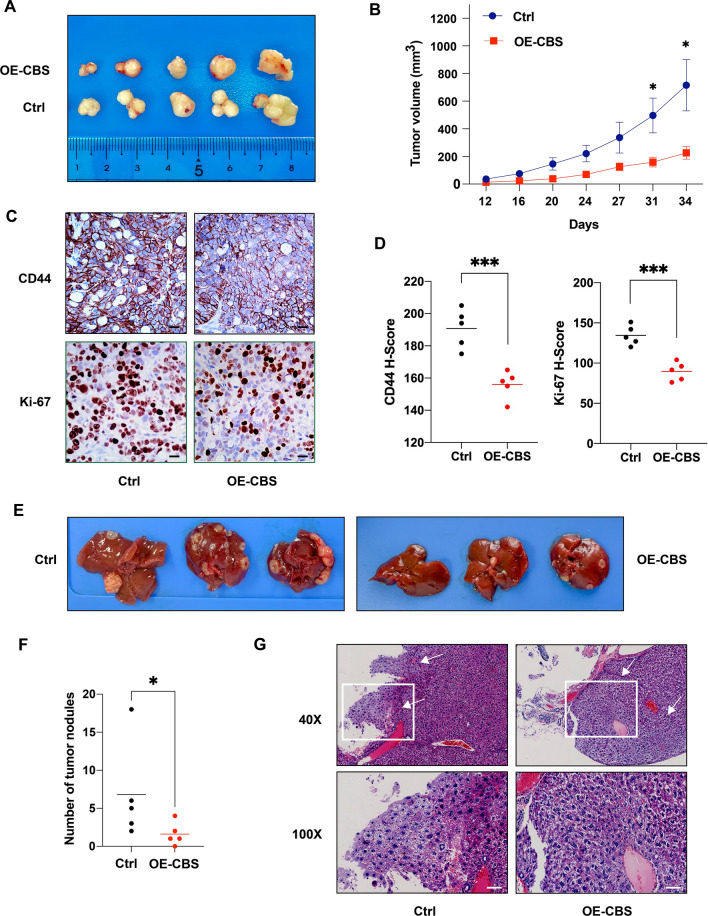
Overexpression of CBS attenuates CRC cell growth and liver metastasis in vivo. A Typical macroscopic pictures of xenograft tumors from subcutaneous injection in HT-29 control and CBS-overexpressing group (n = 6). B Tumor growth trend in HT-29 control and CBS-overexpressing group (*p < 0.05). C Immunohistochemistry results of subcutaneous xenografts from HT-29 control and CBS-overexpressing group. Scale bar, 50 μm. D Statistical analysis of immunohistochemistry results of subcutaneous xenograts from HT-29 control and CBS-overexpressing group based on H-score. (***p < 0.001). E Typical macroscopic pictures of liver specimens harvested at 8 weeks after intrasplenic injection in HT-29 control and CBS-overexpressing group (n = 6). F Statistical analysis of macroscopic metastatic tumor nodules on the liver surface tissues in HT-29 control and CBS-overexpressing group (*p < 0.05). G Typical microscopic pictures of liver metastatic areas in HT-29 control and CBS-overexpressing group. White arrows indicate metastatic areas. Scale bar, 50 μm

