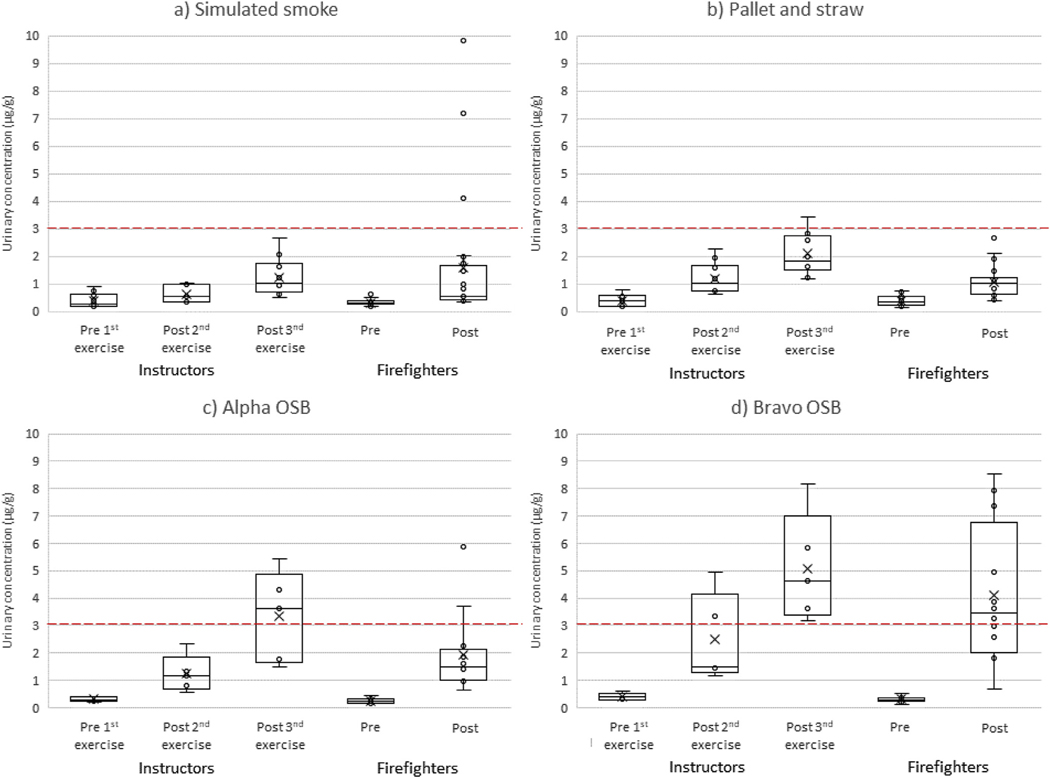
Fig. 1.
Urinary concentrations of hydroxyphenanthrenes by participant type and collection period for training scenarios using a) simulated smoke, b) pallet and straw, c) alpha OSB, and d) bravo OSB. The lower quartile, median, and upper quartile are shown with the box and whiskers (excluding outliers 1.5 times greater or less than the upper and lower quartiles). The mean of the distribution is shown by X. A red dashed line representing the median 3-hr post-firefighting concentration (3.1 μg/g) measured from attack and search firefighters during our residential fire study (Fent et al., In Press-b) is provided for comparison. (For interpretation of the references to colour in this figure legend, the reader is referred to the Web version of this article.)

