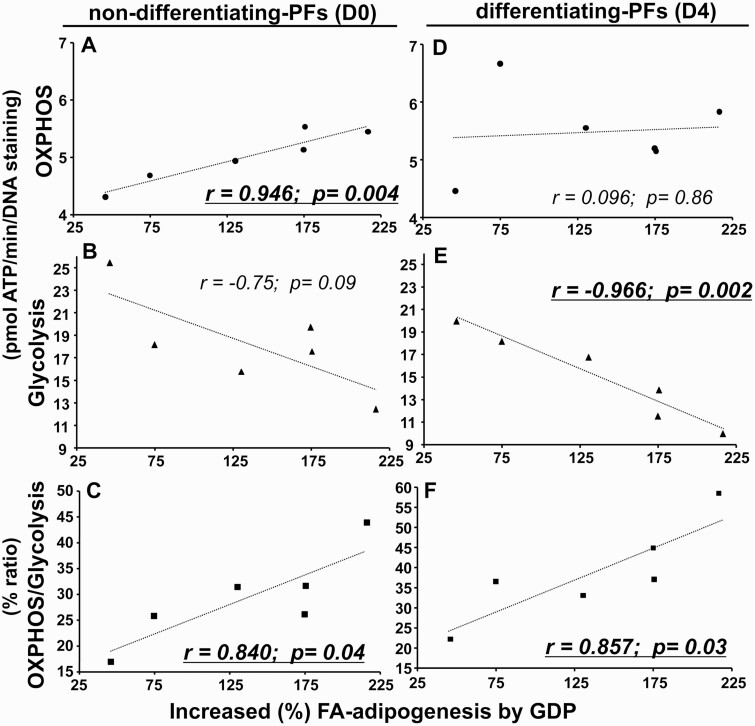
Figure 4.
Correlations of fatty acid (FA)-uptake–driven adipogenesis by guanosine 5′-diphosphate (GDP) treatment with levels of oxidative-phosphorylation (OXPHOS)/glycolysis–adenosine 5′-triphosphate (ATP) in preadipocytes/fibroblasts (PFs) from Graves orbitopathy orbital adipose tissue (OAT-GO). The scatterplot showing the relationship between percentage induced FA-uptake–driven adipogenesis by GDP + FA vs FA only, and levels of A, OXPHOS-ATP (dot); B, glycolysis-ATP (triangle); and C, the percentage ratio of OXPHOS/glycolysis (square) in nondifferentiating-PFs at basal day 0; or D, OXPHOS-ATP levels; E, glycolysis-ATP levels; and F, the percentage ratio of OXPHOS/glycolysis of differentiating PFs on day 4 adipogenesis. Statistically significant Pearson correlations for normally distributed data are underlined.

