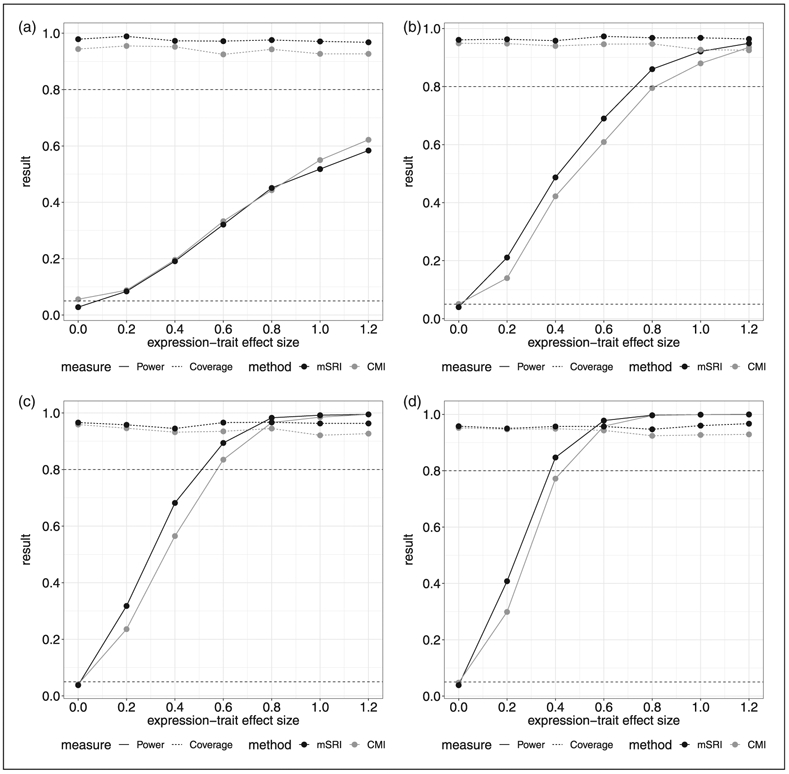
Figure 2.

Estimated power and coverage for mSRI and CMI under a range of alternative effect sizes for the SNP-expression and expression-trait associations. Power is the estimated proportion of significant tests at the 0.05 level when the effect size is non-zero. Coverage is the proportion of 95% confidence intervals that cover the true parameter value used for the simulation.
(a) SNP-expression effect size: α/σδ = 0.4. (b) SNP-expression effect size: α/σδ = 0.6. (c) SNP-expression effect size: α/σδ = 0.8. (d) SNP-expression effect size: α/σδ = 1.0.
