
Figure 4.
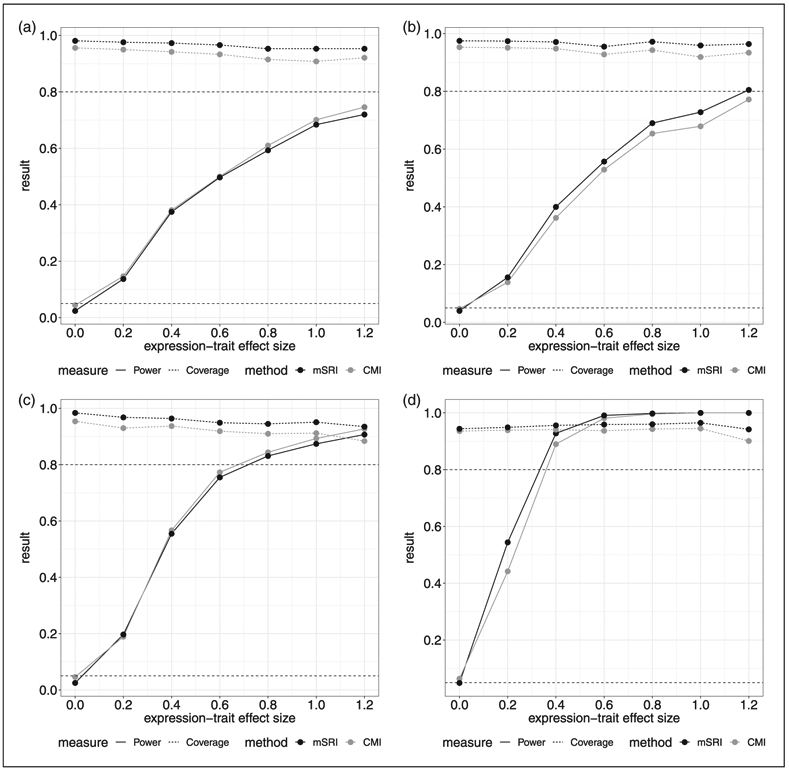
Simulation results based on three inflammasome gene SNPs (rs3917296, rs315952, rs55910638) associated with WB IL1RN expression. Assumed SNP-expression effect estimates are −0.277, −0.164 and −0.205, respectively, with residual standard deviation given by σδ = 1.514. (a) n1 = 175; n2 = 450, (b) n1 = 175; n2 = 650, (c) n1 = 300; n2 = 450, (d) n1 = 175; n2 = 650; SNP-expression effect sizes based on two-times observed estimates.‡
‡In panel (d), effect sizes of all three SNPs are doubled. Genotype data are sampled with replacement from the observed data in the GENE study and GTEx project, preserving within individual links, to achieve corresponding sample sizes.