Figure 7.

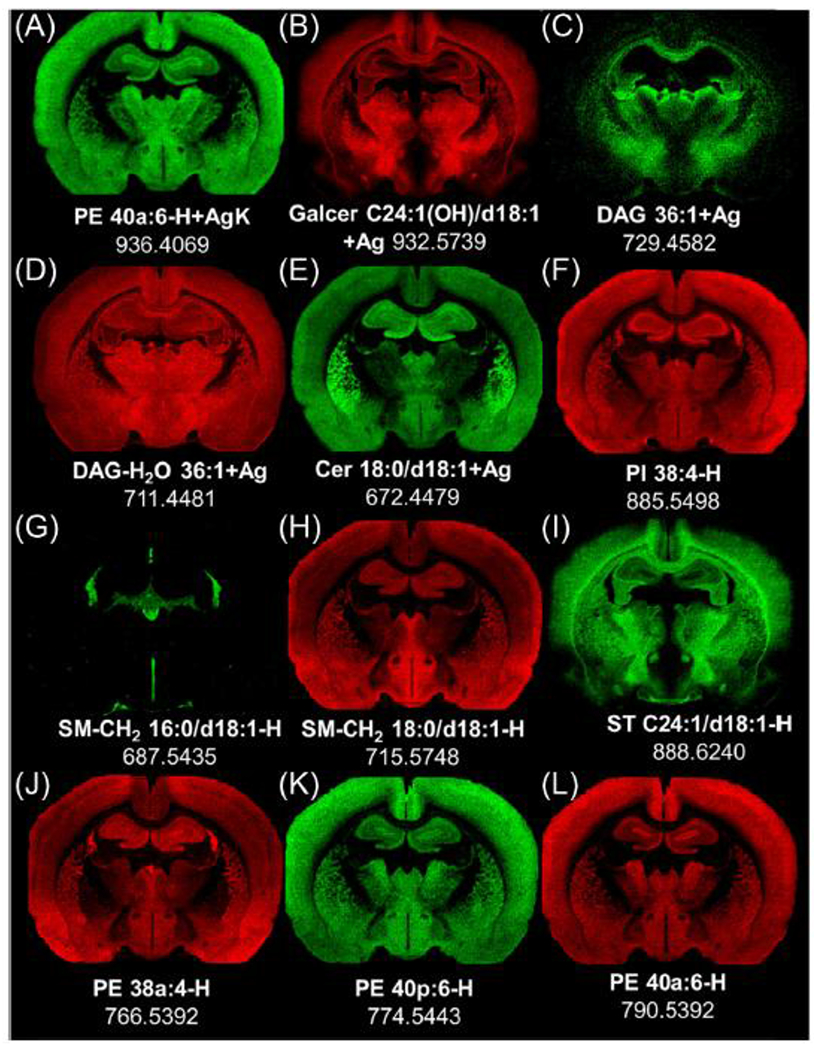
Distribution of different lipids by mass imaging in positive (A-E) and negative (F-L) ion mode images from two serial rat brain frozen sections at level −2.0 mm re: Bregma.

Distribution of different lipids by mass imaging in positive (A-E) and negative (F-L) ion mode images from two serial rat brain frozen sections at level −2.0 mm re: Bregma.