Fig. 2.

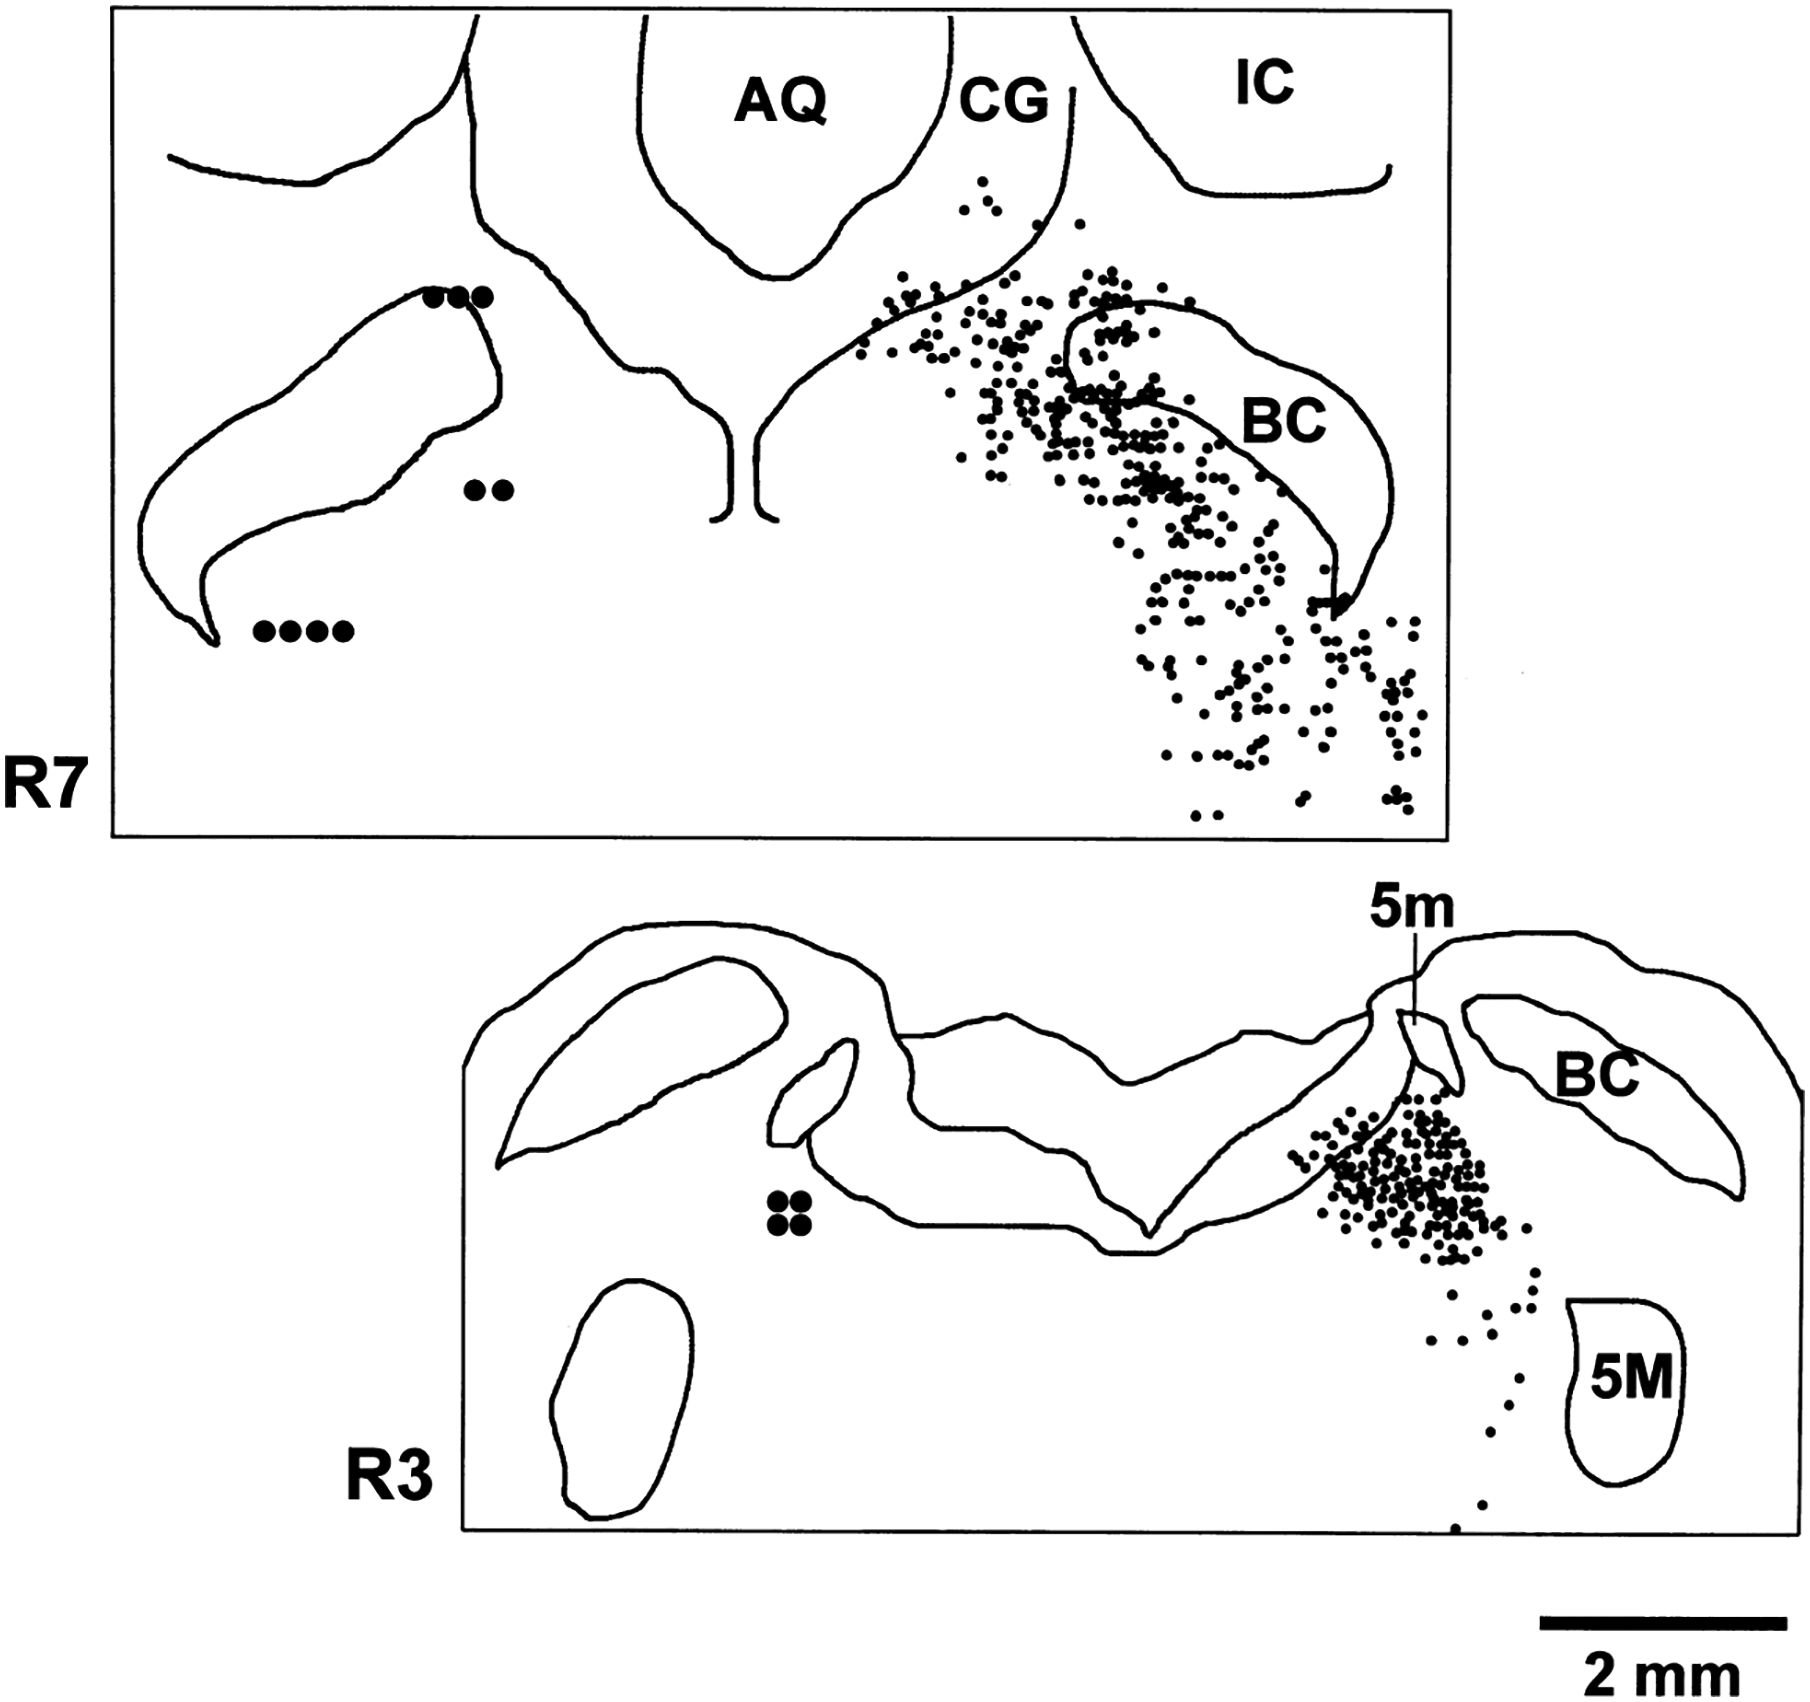
Coronal plots at R3 and R7 levels showing location of recorded REM-cataplexy-off cells on the left and TH-stained cells on the right. REM-cataplexy-off cells were all in regions with TH-positive cells. AQ, aqueduct; IC, inferior colliculus.

Coronal plots at R3 and R7 levels showing location of recorded REM-cataplexy-off cells on the left and TH-stained cells on the right. REM-cataplexy-off cells were all in regions with TH-positive cells. AQ, aqueduct; IC, inferior colliculus.