
Fig. 7.
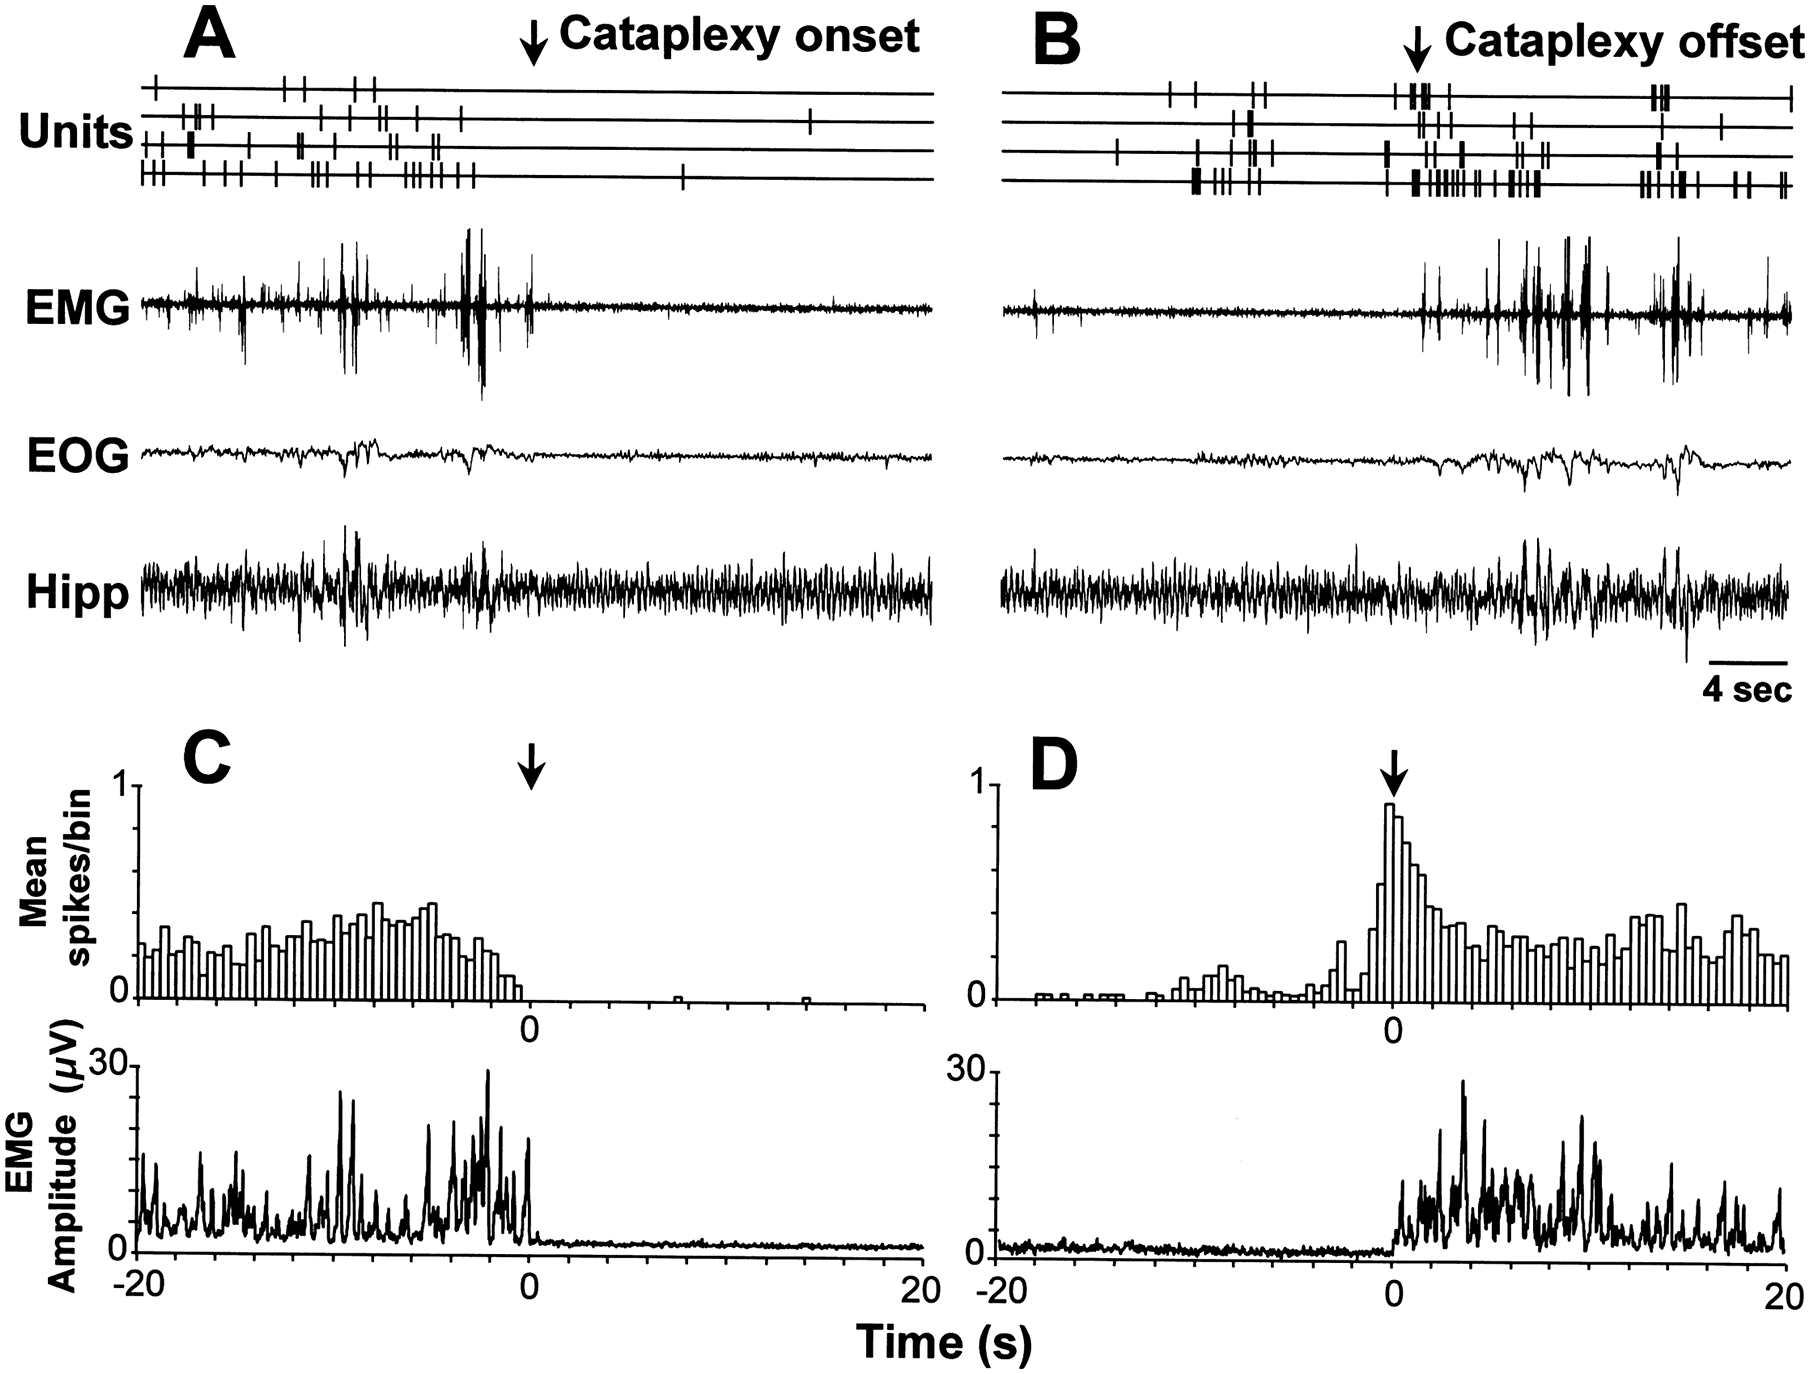
LC discharge during cataplexy. We were able to simultaneously record four REM-cataplexy-off cells throughout sleep/waking states and during episodes of cataplexy. (Top) Unit activity and polygraph traces during cataplexy onset (A) and offset (B). Note the cessation of discharge at cataplexy onset (A) and the resumption of discharge shortly before the termination of cataplexy (B). (Bottom) Averaged spike histogram and EMG before and after cataplexy onset (C) and offset (D). Twenty cataplexy episodes (mean duration 23.7 ± 3.7 s) were averaged across the four cells displayed above. The bin size of the histogram is 400 ms.