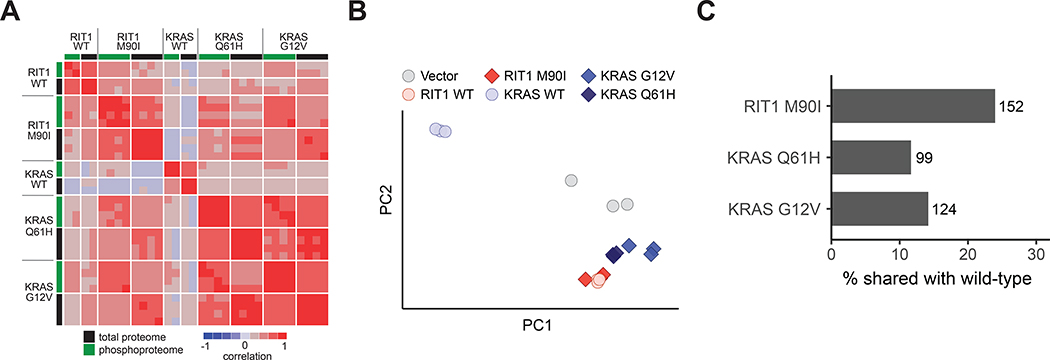
Figure 3. Wild-type RIT1 overexpression mimics oncogenic RIT1 activation.
(A) Correlation heatmap showing pairwise correlations of each proteome and phosphoproteome replicate to every other replicate. To enable correlation of proteome with phosphoproteome, phosphosites were collapsed to the protein level by taking the median of all phosphosites for each protein. Rows are Spearman correlation; columns are Pearson correlation. Proteome and phosphoproteome data were generated from 2 to 4 technical LC-MS/MS replicates per cell line generated from N=2 biological replicates per cell line. (B) Principal component analysis of RNA-seq data from AALE cells. Circles denote individual control vector, RIT1WT, or KRASWT transcriptomes, as labeled; diamonds denote RIT1-variant or KRAS-variant transcriptomes, as labeled. PC1 explains 96.2% of variance, PC2 explains 2.16% of variance. N = 3 RNA-seq libraries per cell line. (C) Bar plot showing percentage of differentially abundant proteins (|Log2Fold-Change| > 2) in wild-type AALE cells that are also differentially abundant in variant AALE cells. Numbers next to bars indicate number of proteins represented; N as described in (A).

