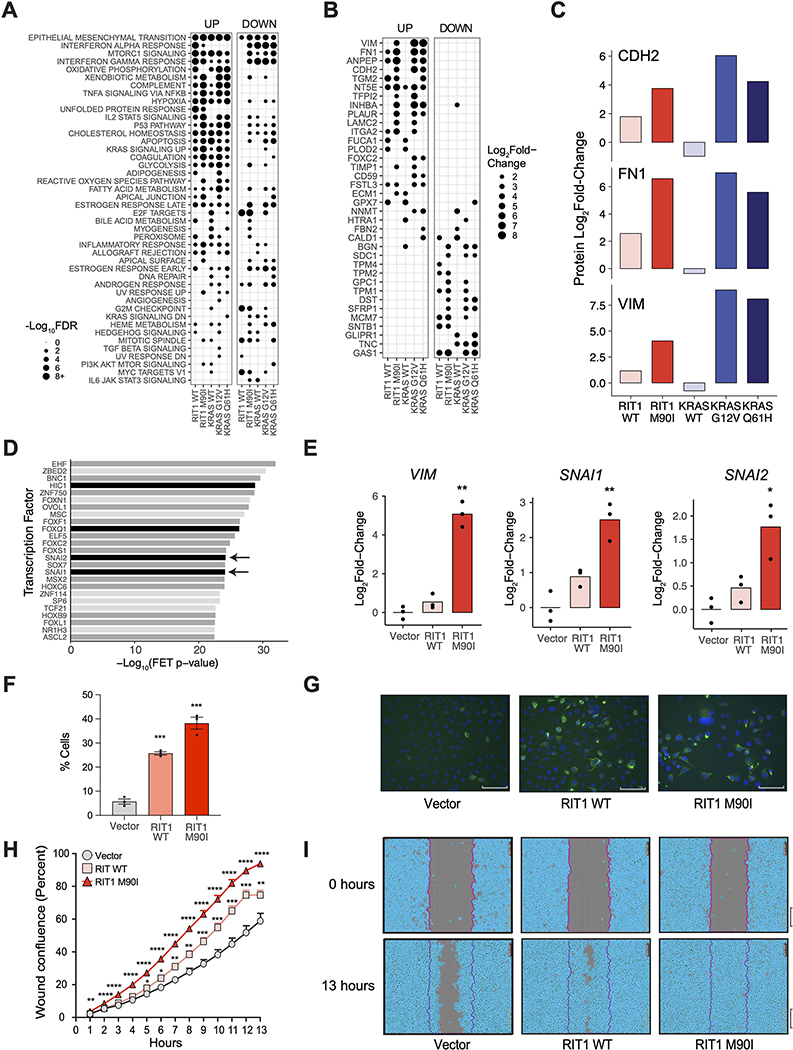
Figure 4. Wild-type RIT1 and RIT1M90I promote an epithelial-to-mesenchymal (EMT) transition phenotype.
(A) Gene set overlap analysis of up-regulated (“Up”; Log2Fold-Change>2) and down-regulated (“down”; Log2Fold-Change<−2) proteins in each condition in AALE cells, using MSigDB Hallmark Pathways (36). Gene sets sorted by descending average −Log10FDR across all conditions. Circle size = −Log10FDR of gene set overlap analysis determined by MSigDB. The analysis was based on data generated from 2 to 4 technical LC-MS/MS replicates per cell line generated from N=2 biological replicates per cell line. (B) Log2Fold-Change in protein abundance of hallmark EMT genes in AALE cells expressing wild-type or variant RIT1 or KRAS relative to abundance in cells expressing the control vector. Proteins are sorted by average Log2Fold-Change across all conditions. N is as described in (A). (C) Log2Fold-Change in protein abundance of N-cadherin (CDH2), fibronectin (FN1), and vimentin (VIM) in AALE cells expressing wild-type or variant RIT1 or KRAS. N is as described in (A). (D) Transcription factor target enrichment analysis of differentially expressed genes in RIT1M90I AALE cells using Enrichr libraries through ChEA3. FET, Fisher’s exact test. Analysis performed on N = 3 RNA-seq libraries compared to 3 vector controls. Arrows indicate proteins of the Snail family. Black denote confirmed EMT genes in dbEMT (49); dark gray denote EMT-associated genes in the literature. (E) Real-time PCR of relative Log2Fold-Change of mRNA expression in perturbed AALE cells of vimentin (VIM), Snail (SNAI1), and Slug (SNAI2). N=3 biological replicates; * P <0.05 and ** P < 0.01 by two-tailed t-test. (F) Immunofluorescence of Vimentin stained cells. N=3 biological replicates; *** P <0.001 by two-tailed t-test. (G) Representative immunofluorescence images of Vimentin stained cells. Scale bar corresponds to 89.1μm. N = 3 replicates per cell line. (H) Wound healing scratch assay. Percent wound confluence at hourly time points are shown with SEM error bars. N=16 replicates per cell line; data shown is representative of N = 3 independent experiments; * P <0.05, ** P <0.01, *** P <0.001, and **** P <0.0001 by two-tailed t-test each time point, corrected for multiple testing. (I) Representative images of wound healing at time of wound making (0 hours) and at end time point (13 hours). Data are representative of 3 independent experiments. Scale bar, 300μm.

