FIGURE 3.
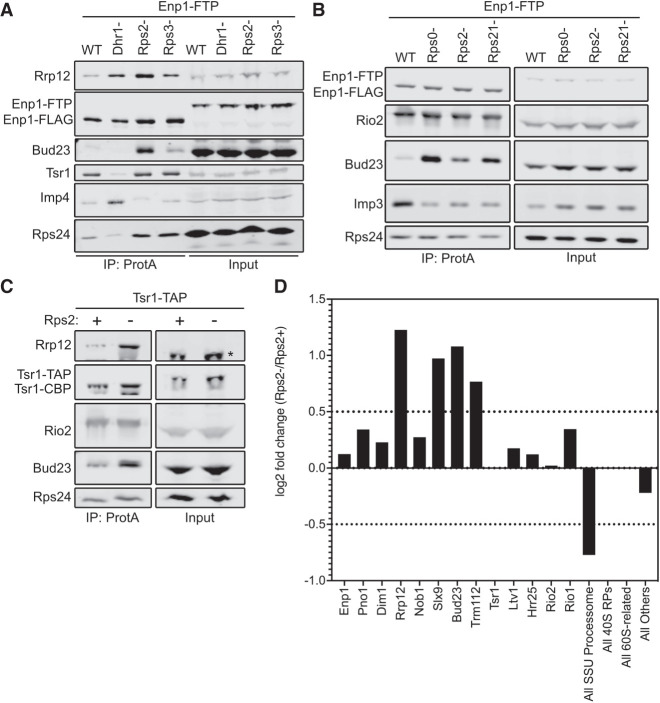
The Rps0-cluster proteins promote the release of Bud23 from the pre-40S. (A) Rps2-depletion caused Bud23 to accumulate on preribosomal particles as shown by western blotting for specific factors that copurified with Enp1–FTP-associated particles in the presence (WT) or absence of Dhr1 (Dhr1-), Rps2 (Rps2-), or Rps3 (Rps3-). Strains AJY4724 (WT), AJY4283 (Rps2-), and AJY4725 (Rps3-) were cultured in YPGal media until early exponential phase, then cultured for 2 h following the addition of 2% glucose to deplete Rps2 and Rps3. Strain AJY4285 (Dhr1-) was cultured for 2.5 h in YPGal, then cultured for 6 h following the addition of 2% glucose to deplete Dhr1. (B) The depletion Rps0, Rps2, and Rps21 each caused Bud23 to accumulate on preribosomal particles, as shown by western blotting for specific factors that copurified with Enp1–FTP-associated particles in the presence (WT) or absence of Rps0 (Rps0-), Rps2 (Rps2-), or Rps21 (Rps21-). Strains AJY4745 (WT), AJY4705 (Rps0-), AJY4706 (Rps2-), and AJY4707 (Rps21-) were cultured in YPGal to early exponential phase, then treated with 2% glucose for 2 h to repress the RP gene transcription. Equal amounts of the affinity-purified particles were separated by SDS-PAGE and subjected to western blotting for the indicated factors. (C) Bud23 accumulated in Rps2-depleted particles as shown by western blotting for specific factors that copurify with Tsr1–TAP-associated pre-40S particles. The asterisks (*) denotes Tsr1–TAP signal in the Input that cross-reacted with the Rrp12 antibody due to the presence of the Protein A tag. Strains AJY4754 (Rps2+) and AJY4755 (Rps2−) were cultured in the same manner as the WT and Rps2− cells in A. (D) Proteomic composition of Tsr1-associated preribosomal particles from C as measured by semiquantitative mass spectrometry is shown as the log2 fold change between Rps2− and Rps2+ samples. These values were calculated as described in Materials and Methods. A factor displaying a log2 fold change value greater than 0.5 (dashed line) is considered to have increased in abundance. Individual factors are ordered by the approximate timing of their known association with 40S precursors. The supporting data are provided in Supplemental File 1.

