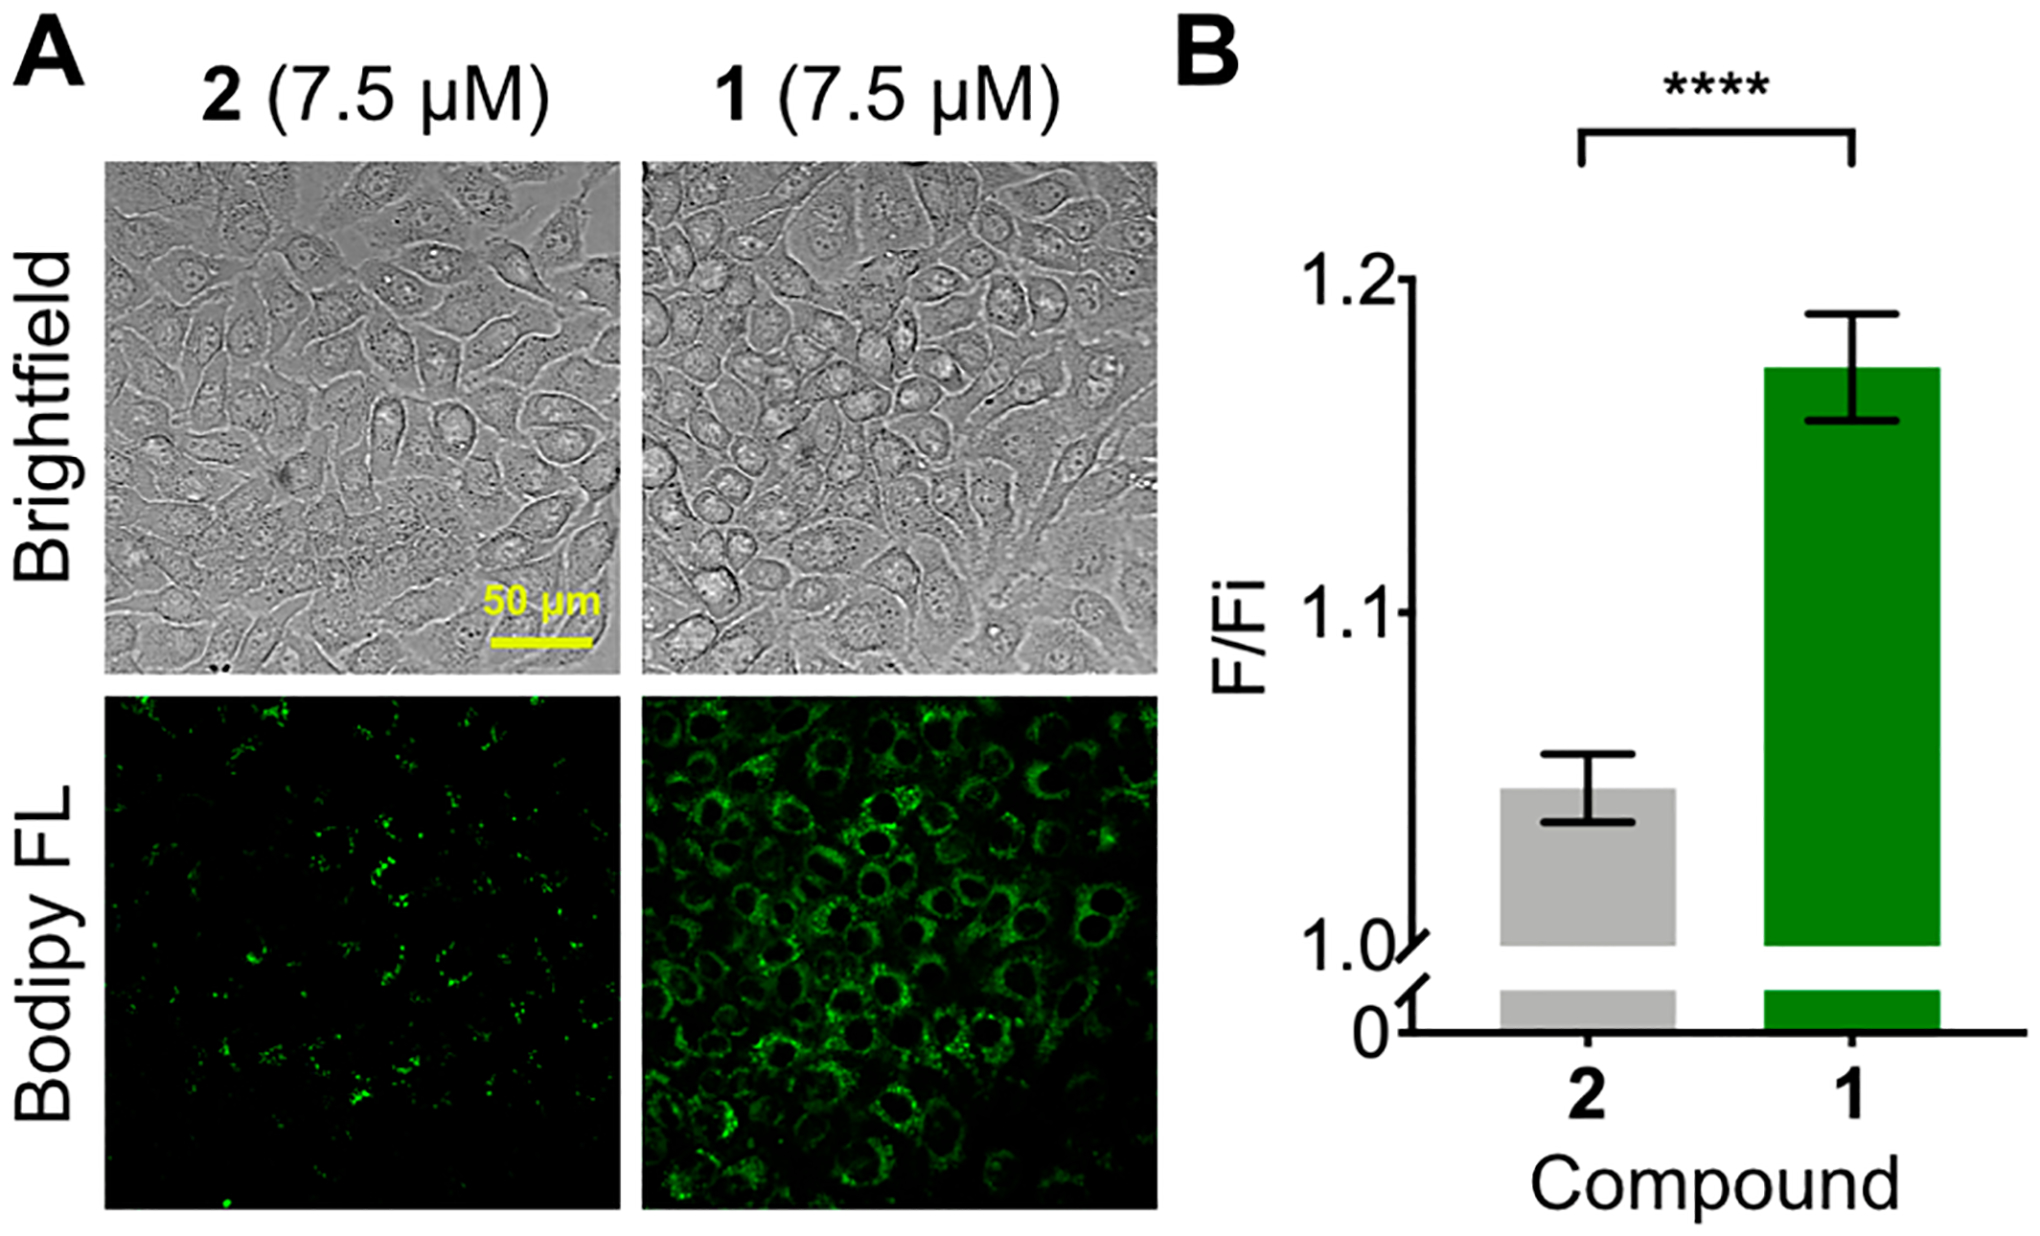
Figure 3.

(A) Fluorescence microscopy images of endogenous sphingosine in HeLa cells treated with probe 1 and control probe 2 for 16 h. (B) Quantified fluorescence turn-on of 1 and 2 (final fluorescence [F]/ initial fluorescence [Fi]) within large populations of cells over 24 h. Values are reported as means ± SD. Significance was determined using an unpaired t test: ****P < 0.0001.
