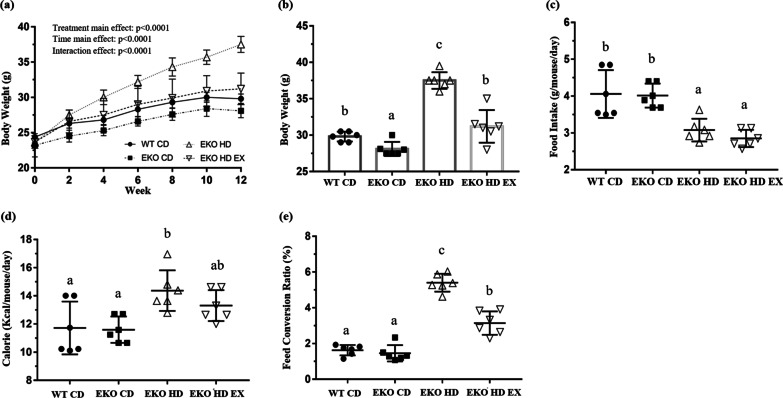
Fig. 1.
Effects of exercise on growth curve, diet, and feed conversion ratio (FCR). Related indices, such as growth curve (a), final body weight (b), food intake (c), caloric intake (d), and FCR (e) were recorded during the experiment. Values are presented as the mean ± SD (n = 6). Different letters indicate significant differences (p < 0.05) compared with the other groups, as assessed by one-way ANOVA. FCR (%): body weight increment/food intake × 100. EKO CD, apolipoprotein E (ApoE) knockout mice fed a normal chow diet; EKO HD, ApoE knockout mice fed a high-fat diet; EKO HD EX, ApoE knockout mice fed a high-fat diet along with swimming exercise; WT CD, wild type mice fed a normal chow diet

