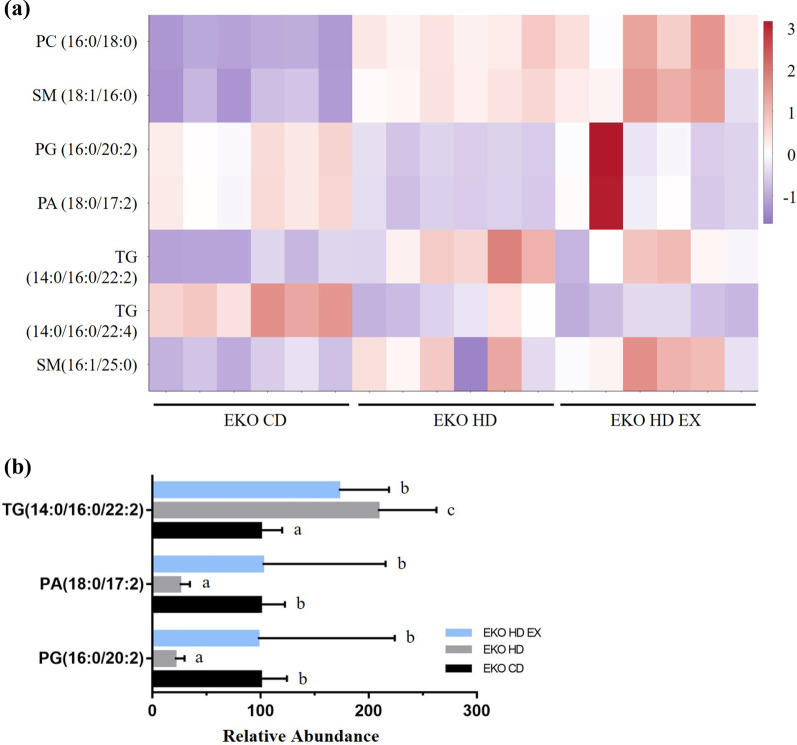
Fig. 7.
Correlation of specific lipid species with exercise and high-fat diet. Heatmap of integrated plasma lipid expression in the EKO CD, EKO HD, and EKO HD EX groups (a). The plasma lipid species, modulated by HFD, were reversed by the exercise intervention (b). The normalized values are presented using the following criteria: p < 0.05, FC > 1, and VIp > 1. Different alphabet (a, b) indicated significant differences among the groups (one-way ANOVA, p < 0.05). PA, phosphatidic acid; PC, phosphatidylcholine; PG, phosphatidylglycerol; SM, sphingomyelin; TG, triglyceride; FC, fold change; VIP, variable importance in the projection

