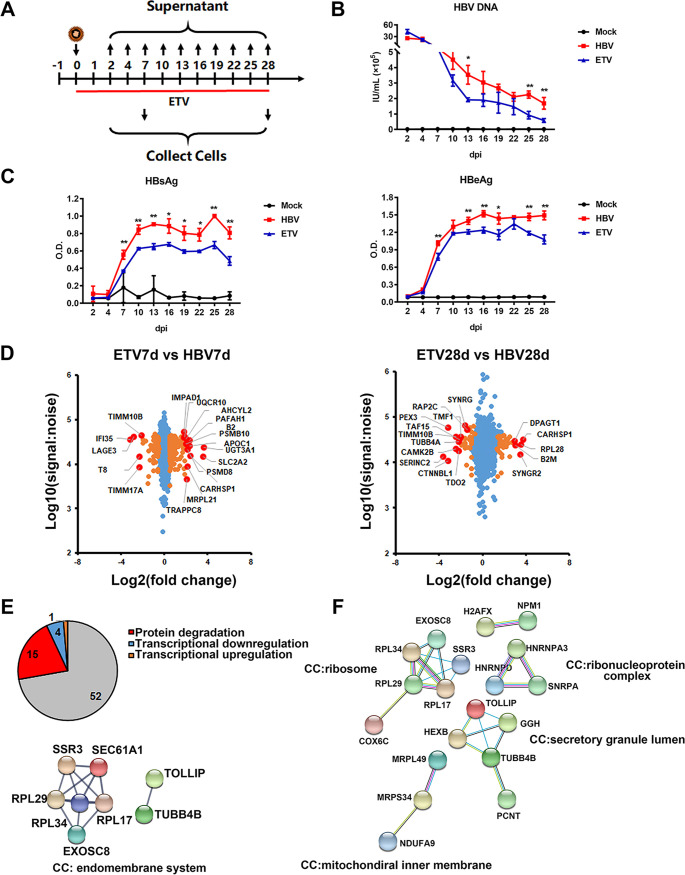
FIG 4.
Identification of proteins dysregulated by HBV while recovered by nucleot(s)ide analogues. (A) 5C-PHH cells infected with HBV (MOI of 200) were treated with or without entecavir (100 nM) at 0 dpi for 28 days. (B and C) Supernatants were collected every 3 days, and HBV DNA (B) and HBsAg and HBeAg analyses (C) via commercial kits were applied. (D) Scatterplots of protein changes in comparison between values of ETV-treated and the corresponding HBV-infected cells (left, 7 dpi; right, 28 dpi). P values were estimated using Benjamini-Hochberg-corrected significance. Orange dots, P < 0.01; red dots, top and bottom deregulated proteins. (E) Overlap of proteins identified in ETV rescue screen (stringent criteria; see Fig. S5A in the supplemental material) and RNA and protein screen. STRING was applied to analyze protein correlation that was degraded by HBV infection but rescued by early ETV treatment. (F) STRING analysis of protein-degraded targets that could not be rescued by ETV treatment.

