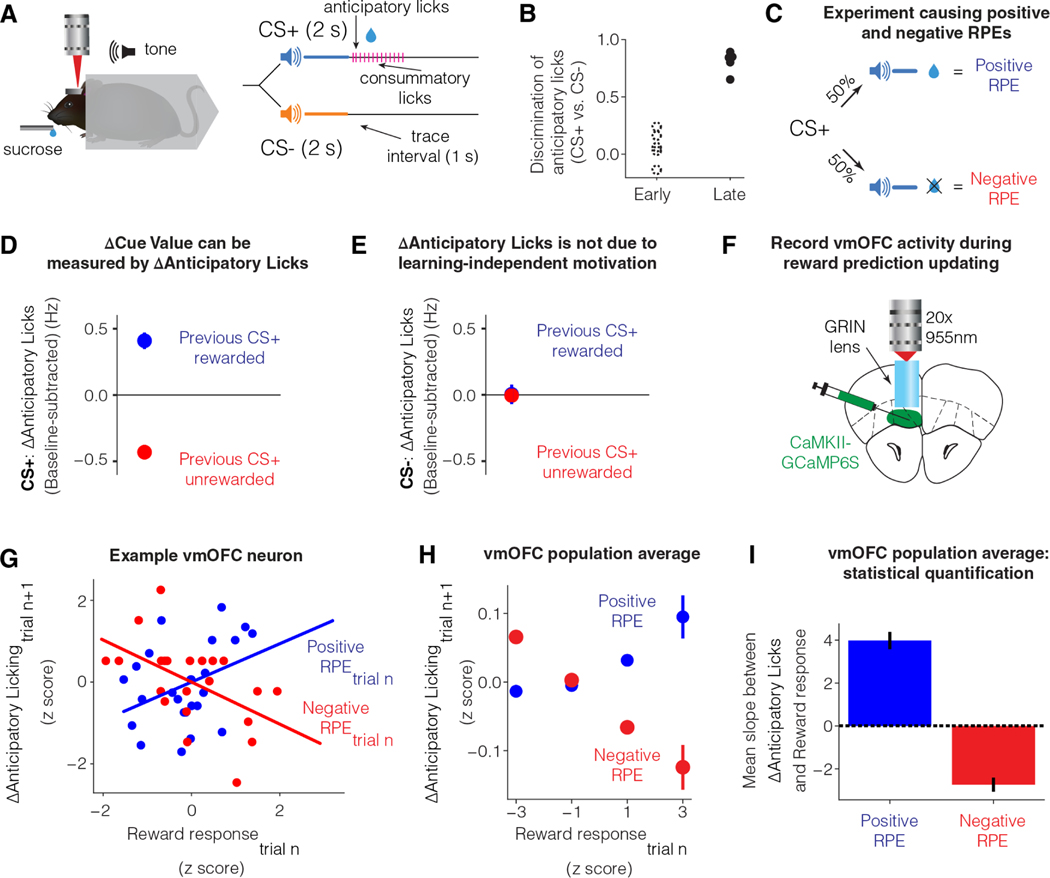
Figure 2: Trial-by-trial fluctuations in vmOFC reward responses reflect learning rate control.
A. Differential trace conditioning task in headfixed mice 26,32.
B. Behavior early and late in learning. Early session was defined as the first day of learning and late session as the day when anticipatory licking in response to CS+ was high and stable (Materials and Methods) 26. Cue discrimination was measured as two times the area under a receiver operator characteristic curve between lick counts after CS+ and lick counts after CS−, minus one (Materials and Methods) 26.
C. Schematic showing that in a session with reward probability of 50%, RPE will be positive on rewarded trials and negative on unrewarded trials.
D. The change in anticipatory licking on consecutive CS+ trials (potentially with interceding CS− trials) is reliably positive after rewarded CS+ trials (positive RPE) and negative after unrewarded CS+ trials (negative RPE) (n=34 sessions from n=12 imaging mice). Thus, update in anticipatory licks can be used to estimate update in cue value. See Table S1 for all statistical results in the manuscript for all figures, including all statistical details and sample sizes.
E. A potential concern is that receiving reward on a CS+ trial might increase general motivation to lick on the next trial, independent of cue value learning. If true, CS− trials immediately following a rewarded CS+ trial should show higher licking compared to CS− trials immediately following an unrewarded CS+ trial. This panel plots the update in anticipatory licking on CS− trials based on whether the immediately preceding CS+ trial was rewarded or unrewarded. The lack of licking update shows that the effect in D is not a learning independent motivation signal. See Figure S2 for evidence of motivation signals during the pre-cue baseline period.
F. Schematic showing the recording of vmOFC activity using two-photon microendoscopic calcium imaging.
G. Data from an example neuron showing the dependence between trial-by-trial update in anticipatory licking on CS+ trials, and trial-by-trial fluctuations in response on rewarded trials (positive RPE) and unrewarded trials (negative RPE). The lines show the best fit regression in each condition. The observed relationship is as expected if vmOFC controls learning rate on a trial-by-trial basis.
H. Z-scored, pooled, and binned data across all vmOFC neurons to visualize the dependence between trial-by-trial response fluctuations and licking update for the population of vmOFC neurons on positive and negative RPE trials. Each neuron’s data were z-scored separately for each axis, all z-scored data were then pooled, and binned into the four bins shown in the plot. Error bars are standard error of the mean. These data are shown purely for an intuitive visualization of the average relationship between these variables in the vmOFC population.
I. Statistical quantification of the average slope between reward response on a trial and licking update on the next trial across all neurons on both positive and negative RPE trials. No z-scoring was performed here to avoid assigning an equal weight to neurons with low or high trial-by-trial variability in responses.

