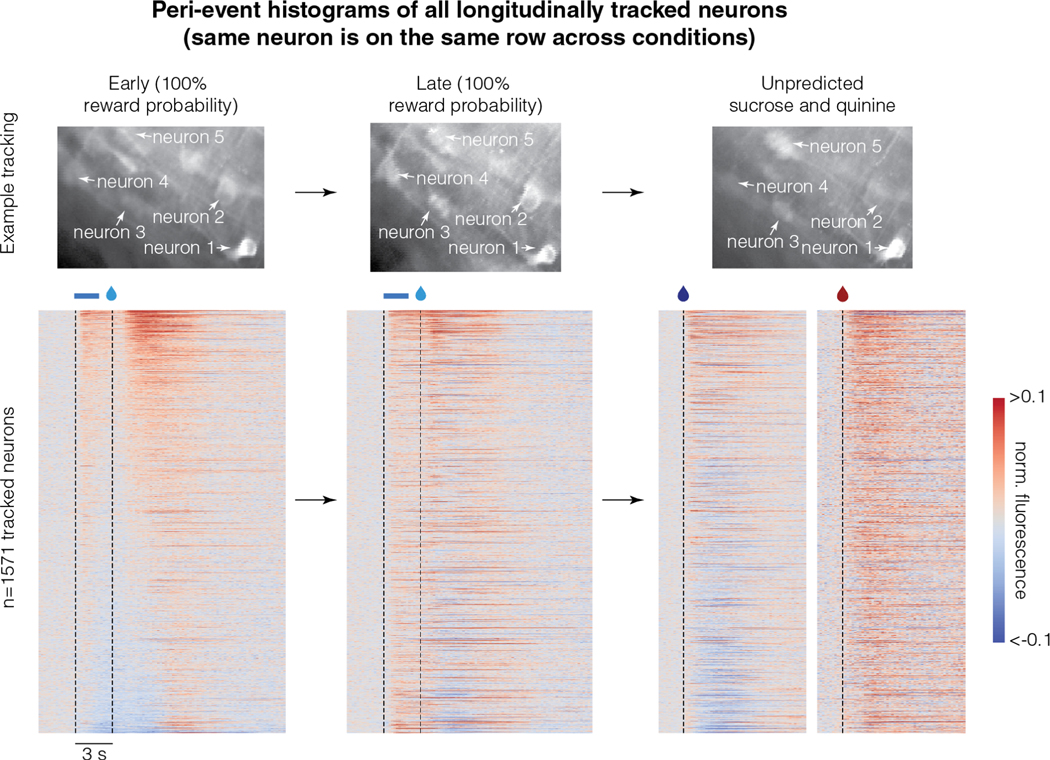
Figure 5. Reward responses of the longitudinally tracked neurons are correlated across three conditions:
Top row shows example longitudinally tracked neurons. Here, the intensity of a pixel corresponds to activity and hence, different brightness across sessions corresponds to different activity levels. The bottom row shows the peri-event histograms of all longitudinally tracked neurons. Each row in this heatmap across the different conditions corresponds to the same neuron. Neurons are sorted by their average activity early in learning. These data show that response to reward is correlated across all conditions (quantified in Table S1). For instance, the neurons that show the lowest amount of activity early in learning tend to be the neurons that show inhibitory reward responses late in learning or in the sucrose and quinine experiment (correlations quantified in Table S1). Please note that the responses of some neurons are saturated in the color map to ensure that the response patterns of most neurons are visible.

