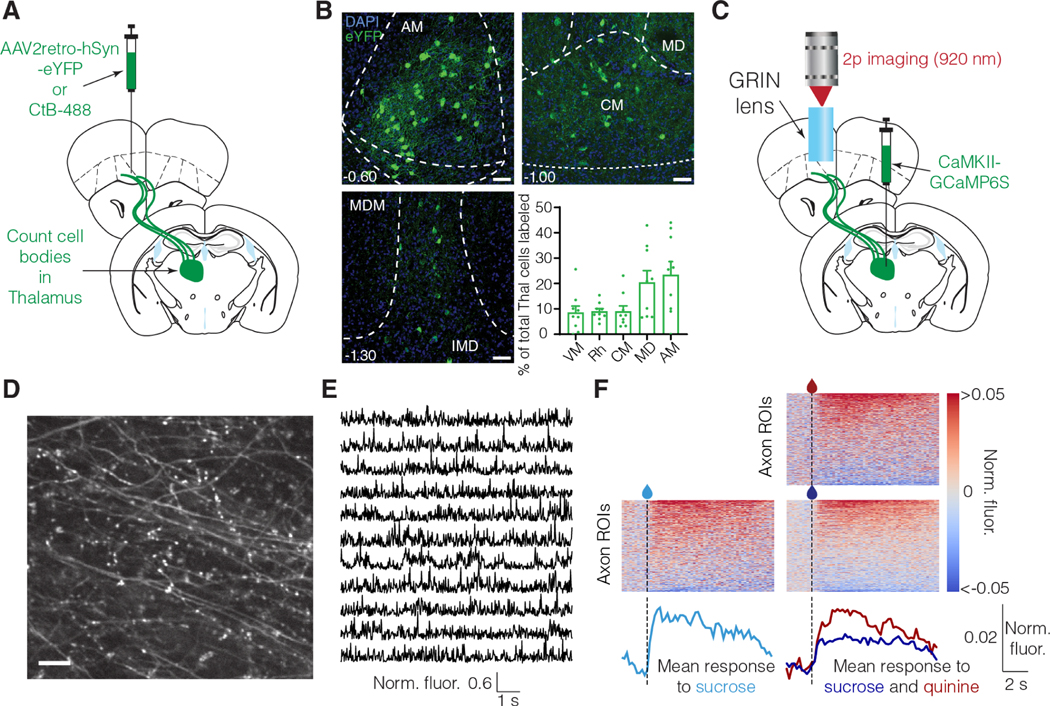
Figure 6: Medial thalamus (mThal) conveys reward responses to vmOFC and shows qualitatively similar reward response adaptation as vmOFC neurons.
A. Surgery schematic for retrograde anatomical tracing, showing injections of either retrogradely traveling virus (AAV2retro) or Cholera Toxin-B (CTB).
B. mThal cell bodies projecting to OFC counted using CTB and AAV2retro labeling. Representative images show AAV2retro expression (see Figure S6 for CTB expression). Top 5 thalamic regions are shown. See Figure S6 for counts in all thalamic nuclei, split by AAV2retro and CTB injections. AM: Anteromedial, MD: Mediodorsal, CM: Centromedial, Rh: Rhomboid, VM: Ventromedial. Scale bar = 50 μm.
C. Surgery schematic for mThal axon imaging in vmOFC.
D. Example zoomed-in mThal axon standard deviation projection image showing individual axons in vmOFC. The scale bar corresponds to 10 μm.
E. Example mThal GCaMP traces from individual axonal regions of interest (ROIs) (Methods).
F. Heat maps show trial-averaged responses from individual axon ROIs (do not necessarily correspond to distinct axons, see Figure S6 and Methods for details and interpretation) to unpredicted sucrose alone (left) or unpredicted sucrose and quinine (right, similar experiment as Figure 4A). The bottom traces show the average responses across all segmented mThal axon ROIs aligned to the first lick after liquid delivery (dashed line). The same animals (n=3) were used under all conditions, to be directly comparable; see Figure S6 for data from two more animals in the sucrose only condition. Mean sucrose response across the population is lower in the session with quinine compared to the session without quinine. The statistical test was applied using the mean fluorescence across all ROIs per animal as an independent measure. This adaptation is qualitatively similar to that seen in some vmOFC clusters (Figure 4).

