Figure 2.
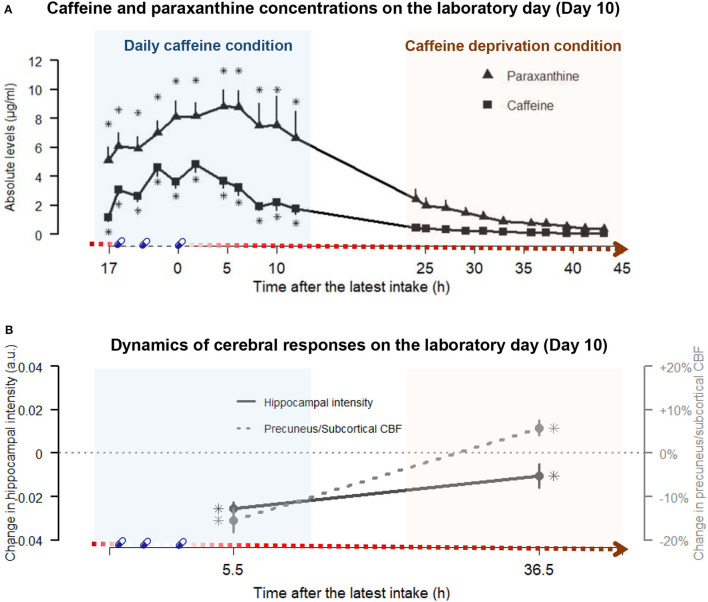
The paraxanthine and caffeine concentrations at the respective time points and the dynamics of cerebral responses on the laboratory day (day 10) in daily caffeine and caffeine deprivation conditions, respectively. (A) juxtaposes the profiles of caffeine (squares) and paraxanthine (triangle) in caffeine condition (blue shading, left panel) and after the caffeine deprivation (red shading, right panel) against the duration after the latest dose of caffeine on the x-axis. Echoing Figure 1, the gradient red arrow parallel to the x-axis schematically indicates the duration of the caffeine deprivation. The times of treatments are denoted by blue capsules. Detailed statistics are addressed in the Result section. In brief, the main effects of conditions indicated that paraxanthine levels remained elevated throughout the caffeine and the caffeine deprivation conditions compared to placebo, while caffeine levels were elevated in caffeine conditions but did not significantly differ from placebo in the deprivation. Asterisks (*) indicated the time points exhibiting significantly elevated levels compared to placebo by a post-hoc analysis on the significant Condition x Sample interaction. (B) illustrates the magnitudes of the changes in hippocampal GM intensity (straight line) and the precuneus + subcortical CBF quantity (dashed line) during daily caffeine intake and after caffeine deprivation, relative to placebo (dotted horizontal line). The asterisks indicated significant differences compared to placebo. Detailed statistics are addressed in the Results section.

