FIGURE 6.

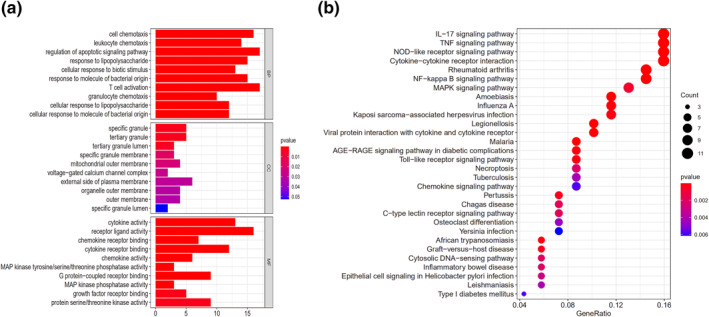
Functional enrichment analysis of the genes in the key modules. (a) GO enrichment analysis of sex differences in IS. (b) KEGG enriched the regulatory pathways of sex differential expressed genes in IS

Functional enrichment analysis of the genes in the key modules. (a) GO enrichment analysis of sex differences in IS. (b) KEGG enriched the regulatory pathways of sex differential expressed genes in IS