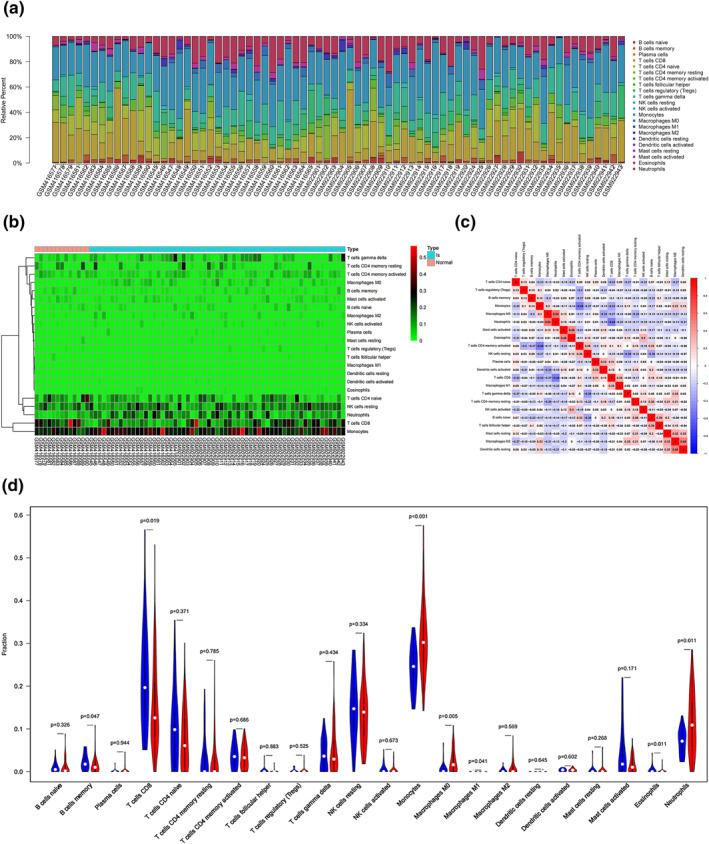
FIGURE 7.

Immune infiltration situation in peripheral blood samples from females with IS and healthy ones. (a) Histogram of percentage distribution of 22 immune cell subtypes. (b) Hot map of percentage distribution of 22 immune cell subtypes. (c) Heat map of 22 immune cells in both samples. Positive and negative correlations were shown as red and blue, respectively. (d) Violin plot of differences in immune cell infiltration between females with IS and healthy ones. Blue, healthy females; Red, IS females
