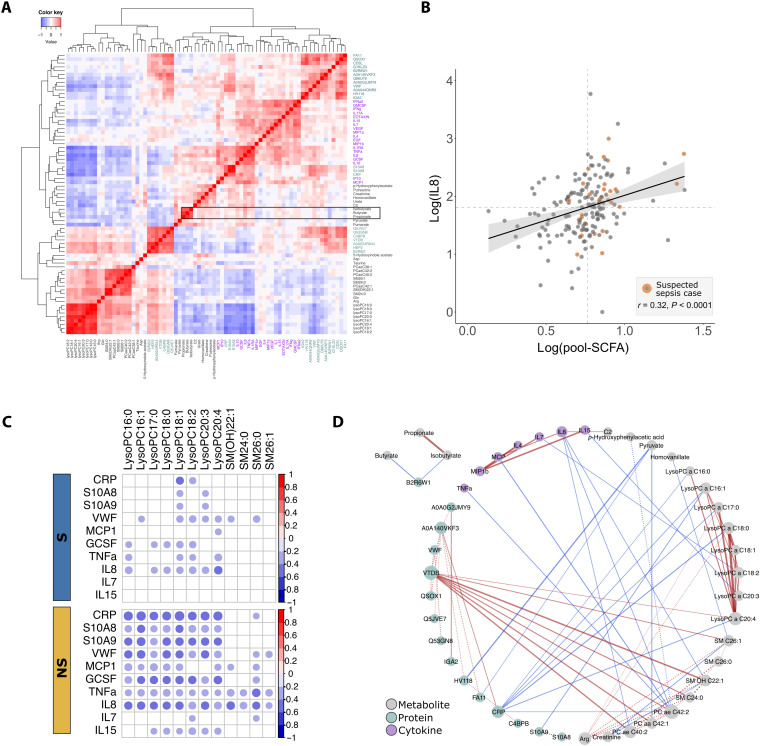
Fig. 4. Cross-correlations of differential analytes.
(A) Heatmap of hierarchical clustering of pairwise correlation among 32 differential metabolites (gray labels), 22 differential proteins (green labels), and 19 measured inflammatory mediators (purple labels) in all subjects. Correlations of SCFAs are highlighted in the black rectangle. (B) Correlations of pool SCFAs (sum of propionate, isobutyrate, and butyrate) with IL8. Dashed lines denote median levels of SCFA and IL8. (C) Group-specific correlations between lipids and inflammatory mediators and acute phase proteins among S compared to NS. Significant (PFDR < 0.05) correlations are represented by circles. (D) Differential correlation network. Nodes are analytes, and edges connect analyte pairs with differential correlations between groups (P∆r < 0.05). Solid edges denote increased and dashed edges denote reduced strengths of correlation in the NS, with their relative widths corresponding to the absolute difference in correlation strengths. Since no reversed correlation was detected, positive correlations are indicated by red edges and negative correlations are indicated by blue edges. Node color and size correspond to analyte classes and node degree, respectively.

