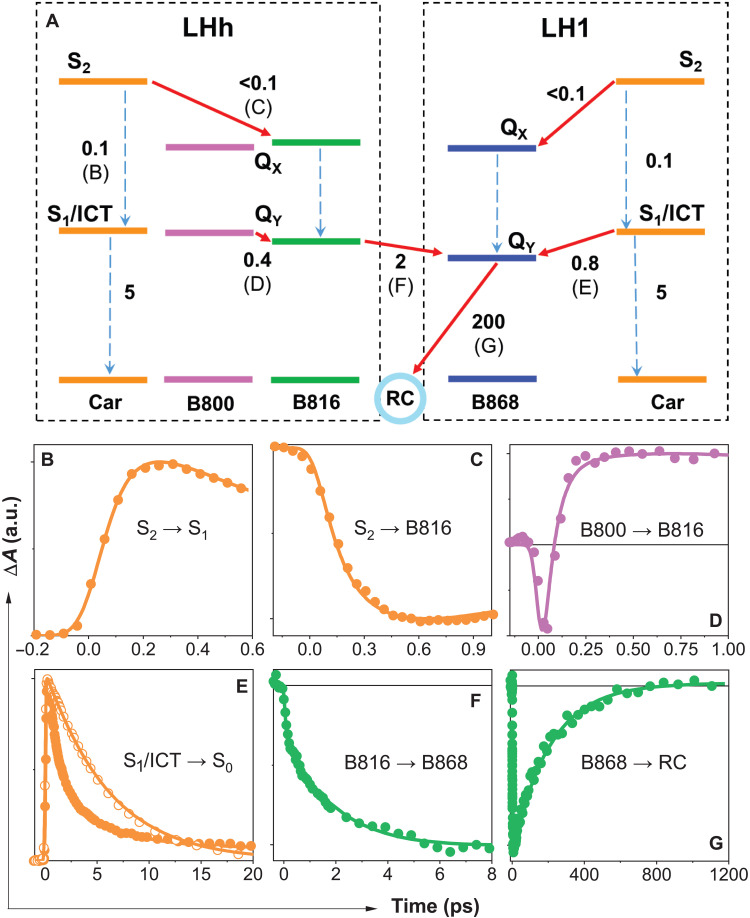
Fig. 7. ET kinetics in the RC-dLH1 complex.
(A) The two boxes (black dashed lines) map the ET events in the outer LHh and inner LH1 antenna rings. Solid red arrows represent ET channels; dashed arrows correspond to internal conversion processes. A time constant (in picoseconds) is associated with each process. The letters B to G associated with ET/internal conversion processes in the scheme correspond to the kinetics shown in (B) to (G), which monitor the dynamics of these processes. Color of each kinetic corresponds to excitation of carotenoids (orange), B800 (purple), and B816 (green). The probing wavelengths are within the bands corresponding to the gemmatoxanthin S1/ICT state (620 nm; B and E), B816 bleaching (820 nm; C), B816 excited-state absorption (805 nm; D), and B868 bleaching (880 nm; F and G). The kinetics shown as open symbols in (E) corresponds to the S1/ICT lifetime of gemmatoxanthin in methanol. Full transient absorption spectra showing the spectral bands and a detailed description are shown in fig. S13. a.u., arbitrary units.

