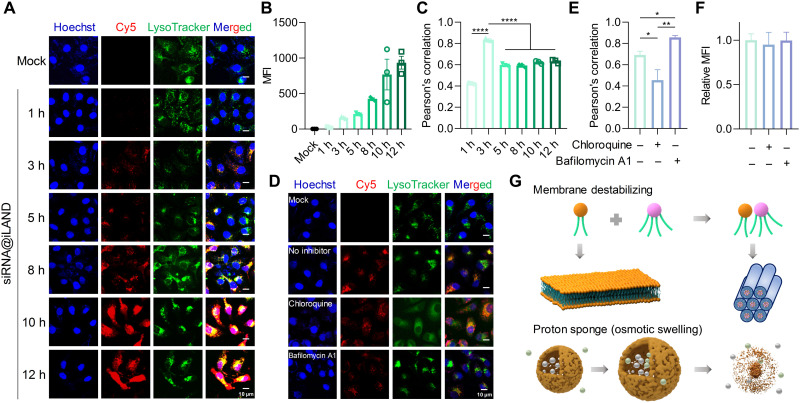
Fig. 4. Intracellular trafficking and endosomal escape of siRNA@iLAND.
(A) Cellular uptake of Cy5-siRNA@iLAND in HepG2 cells at different transfection time points. (B) Intracellular fluorescence intensities of siRNA at different time points after transfection. (C) Colocalization between Cy5-siRNA and endosome or lysosome. The highest level occurred around 3 hours after transfection. (D) Influence of chloroquine and bafilomycin A1 on cellular entry and endosomal escape of siRNA@iLAND. (E and F) Colocalization analysis (E) and MFI of siRNA in cells (F) that recorded in (D). (G) Scheme of iLAND-mediated siRNA escape from endosome (or lysosome). siRNA was transfected at a final concentration of 50 nM. n = 6.

