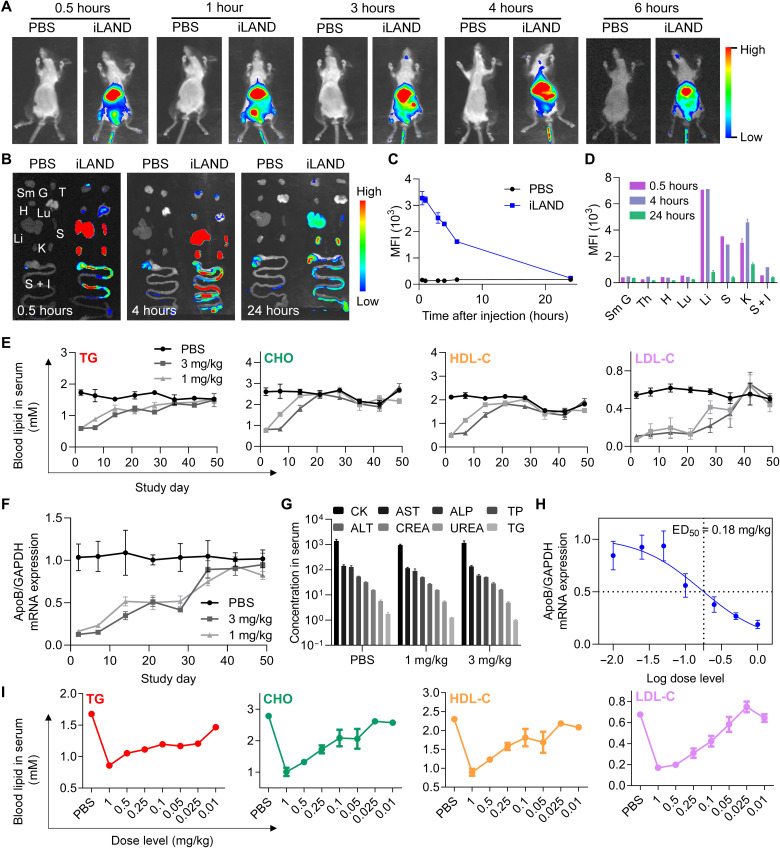
Fig. 5. In vivo biodistribution and activity evaluation of siRNA@iLAND.
(A) Whole-body imaging of the mice at indicated time points after intravenous injection of 1× PBS or Cy5-siRNA@iLAND (2 mg/kg). (B) Fluorescent imaging of isolated organs at 0.5, 4, and 24 hours after injection. Sm G, submandibular gland; T, thymus; H, heart; Lu, lung; Li, liver; S, spleen; K, kidney; S + I, stomach and intestines. (C) Quantitative analysis of the fluorescence signal in the liver as recorded in whole-body imaging. (D) Quantitative analysis of the fluorescence signal in isolated organs at indicated time points. (E) Concentrations of TG, CHO, HDL-C, and LDL-C in serum specimens collected at indicated time points from the mice receiving a single dose of 1× PBS, 1 mg/kg siApoB@iLAND, or 3 mg/kg siApoB@iLAND. (F) ApoB mRNA expression in liver tissues collected in the assay of (E). At each time point, the animals were euthanized and the livers were collected. Then, total RNA was extracted for determination of mRNA expression. (G) Serum biochemistry analysis. Samples were collected from CD-1 mice receiving 1× PBS, 1 mg/kg siNC@iLAND, or 3 mg/kg siNC@iLAND. Eight parameters including creatine kinase (CK; U/liter), aspartate aminotransferase (AST; U/liter), alkaline phosphatase (ALP; U/liter), total protein (TP; g/liter), alanine aminotransferase (ALT; U/liter), serum creatinine (CREA; μM), urea nitrogen (UREA; μM), and TG (mM) were recorded. (H) ApoB mRNA expression in the mice receiving different doses of siApoB@iLAND complexes. The doses ranged from 0.01 to 1 mg/kg. (I) Serum lipid changes in the dose-dependent assay.

