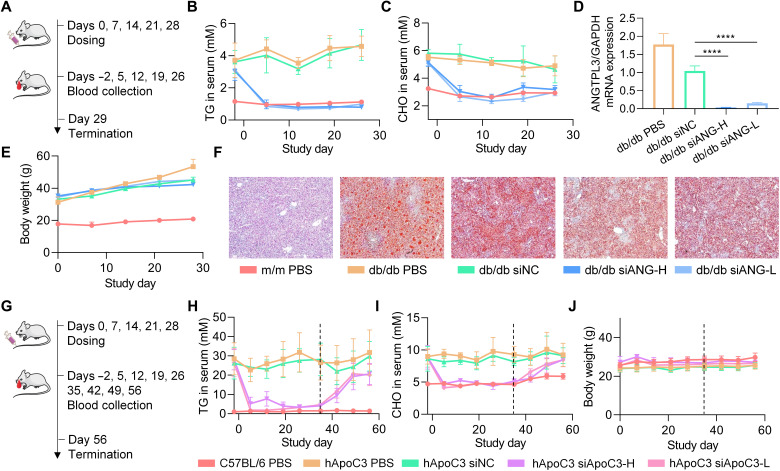
Fig. 6. Efficacy studies of siANG@iLAND and siApoC3@iLAND in disease models.
(A) Treatment schedule of siANG@iLAND in db/db mice. (B and C) Levels of serum TG (B) and serum CHO (C) recorded during the treatment course. (D) ANGPTL3 mRNA expression determined by RT-qPCR at the end of study. (E) Body weight changes during the study. Serum specimens were collected after a 6-hour food fasting for determining the TG and CHO concentrations, and the body weights were recorded before food fasting. (F) Oil red O staining of the liver sections of each group. (G) Treatment schedule of siApoC3@iLAND in hApoC3-Tg mice. (H and I) Levels of serum TG (H) and serum CHO (I) recorded during the treatment and recovering courses. (J) Body weight changes during treatment and recovery periods.

