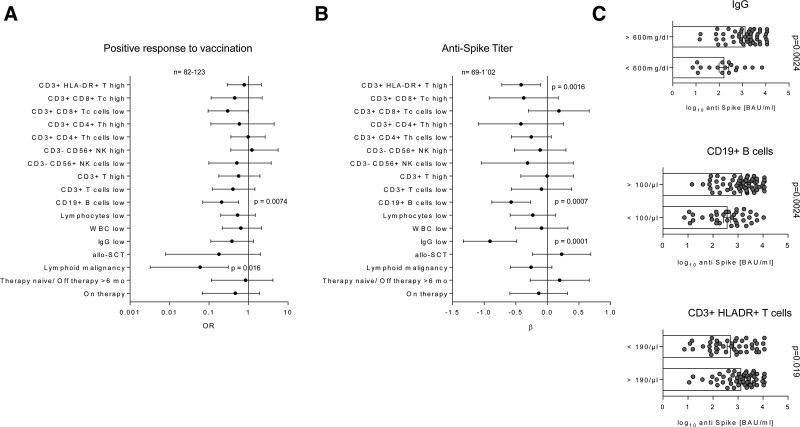
Figure 2.
Univariable modeling of the positive vaccination response and post-vaccination antibody titer. Correlation of the candidate factors affecting the probability of positive vaccination response (A, > 7 BAU/mL) and antispike antibody titer in the individuals with positive antibody response (B) was investigated by a series of univariable logistic and linear regression models, respectively. Significance of the model estimates was determined by Wald Z test (logistic regression: OR/odds ratio) or T test (linear regression: β), as appropriate, and corrected for multiple testing with Benjamini-Hochberg method. Estimate values with 95% confidence intervals are presented in Forest plots. Ranges of complete observations are indicated under the plots. (C) Antispike antibody titer in the individuals with positive antibody response was investigated in the study participants stratified by pre-vaccination circulating IgG, CD19+B cells and CD3+HLA-DR+ T-cells levels. Statistical significance was determined by two-tailed T test. Test p values are presented in the plot captions. allo-SCT = allogeneic stem cell transplantation; B = B cells; IgG = immunoglobulin G; LYM = lymphoid malignancy; NK = natural killer cells; T = T cells; Tc = cytotoxic T-cells; Th = T helper cells; WBC = white blood cells.

