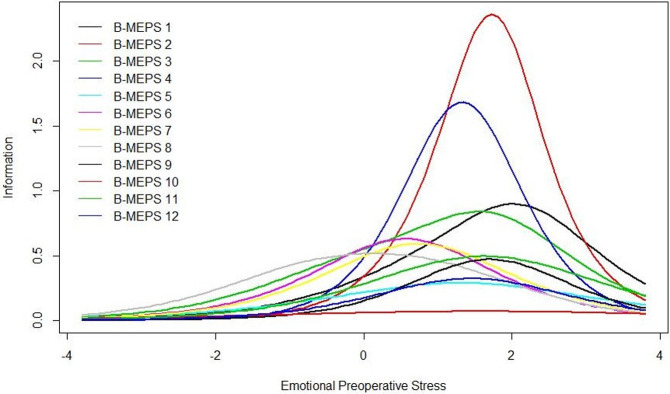
Fig 3. Item information curves of B-MEPS.
The horizontal axis reflects the latent trait level of the test taker and the vertical axis reflects the probability of endorsing an item. The curve shows the region where the group of items (B-MEPS) estimates the latent trait of “emotional preoperative stress” with greater accuracy. The item characteristic curve represents the probability of patients positively answering the items according to their emotional stress on a continuum. B-MEPS: Brief Measure of Emotional Preoperative Stress.

