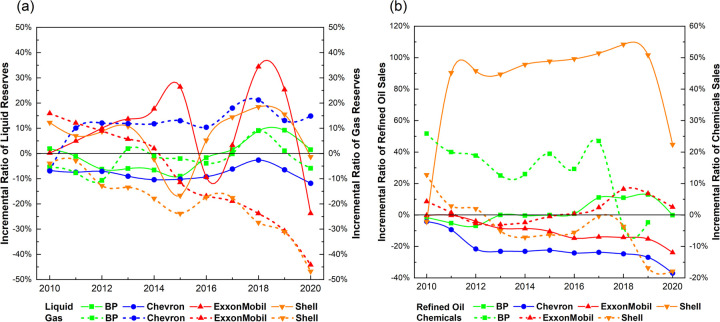
Fig 6. Fossil fuel reserves and petroleum sales.
(a) Fossil fuel reserves in the incremental ratio (2010~2020). (b) Petroleum sales in the incremental ratio (2010~2020). Note: Results for Chevron are not included in (b), since its data on chemical sales are not publicly disclosed. BP’s data on chemical sales in 2020 is not released.

