
Figure 1.
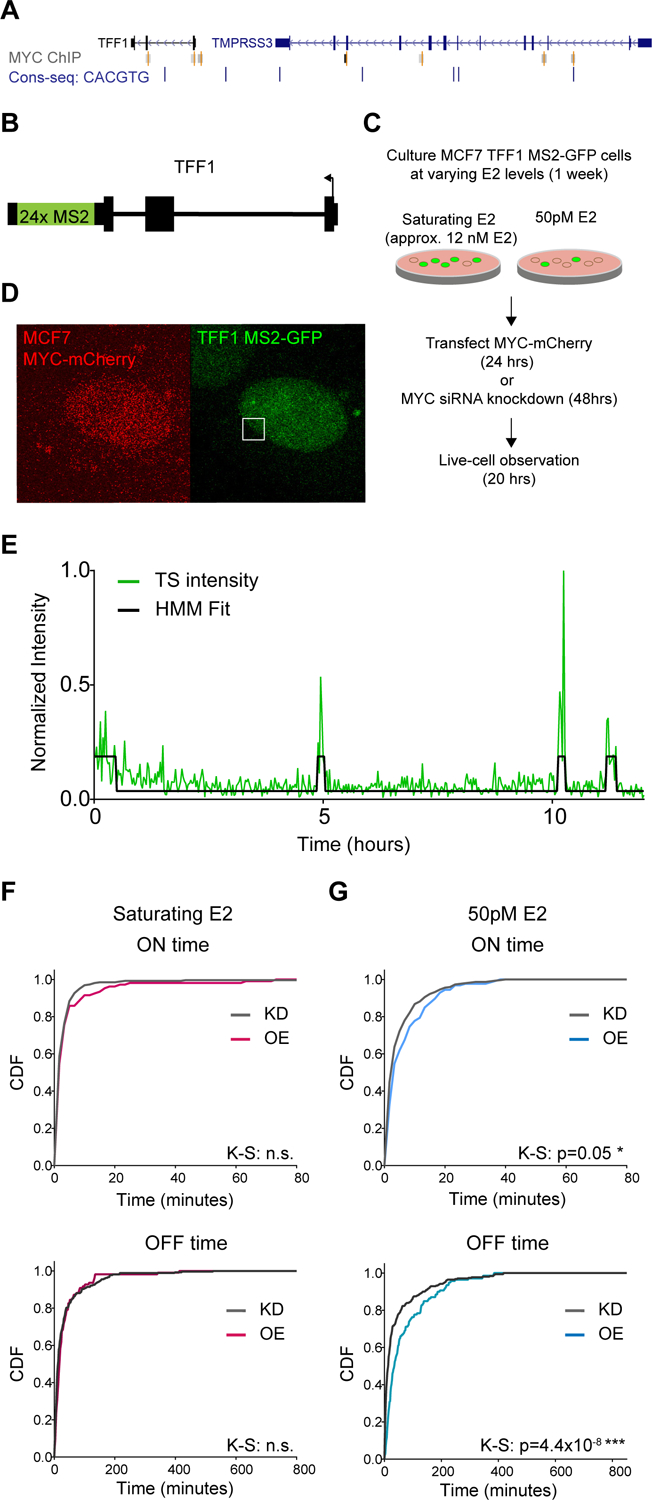
The endogenous gene TFF1 is responsive to MYC perturbations at non-saturating induction levels.
(A) Genome browser screenshot of MYC ChIP-seq peaks (gray) and the E-box consensus motif (blue) at the loci of TFF1 and its enhancer in TMPRSS3.
(B) Schematic of the MS2 insertion in the TFF1 endogenous locus.
(C) Schematic of live-cell experiment with MYC perturbation.
(D) Example frame of a live-cell timeseries of MYC-mCherry overexpression in MCF7 cells. Frames are a maximum projection of a z-stack. TFF1 transcription site indicated by a white square.
(E) Example trace of TFF1 transcription site activity (green line) fit to a 2-state HMM (black line) to categorize gene activity into ‘ON’ and ‘OFF’ periods.
(F) Normalized CDF of TFF1 ON and OFF times with MYC knockdown (KD) or overexpression (OE). Cells were culture at saturating E2 (KD=15 cells, OE=8 cells).
(G) As in (F) for 50pM E2. Cells per condition: KD=22 cells, OE=13 cells.