Figure 2.

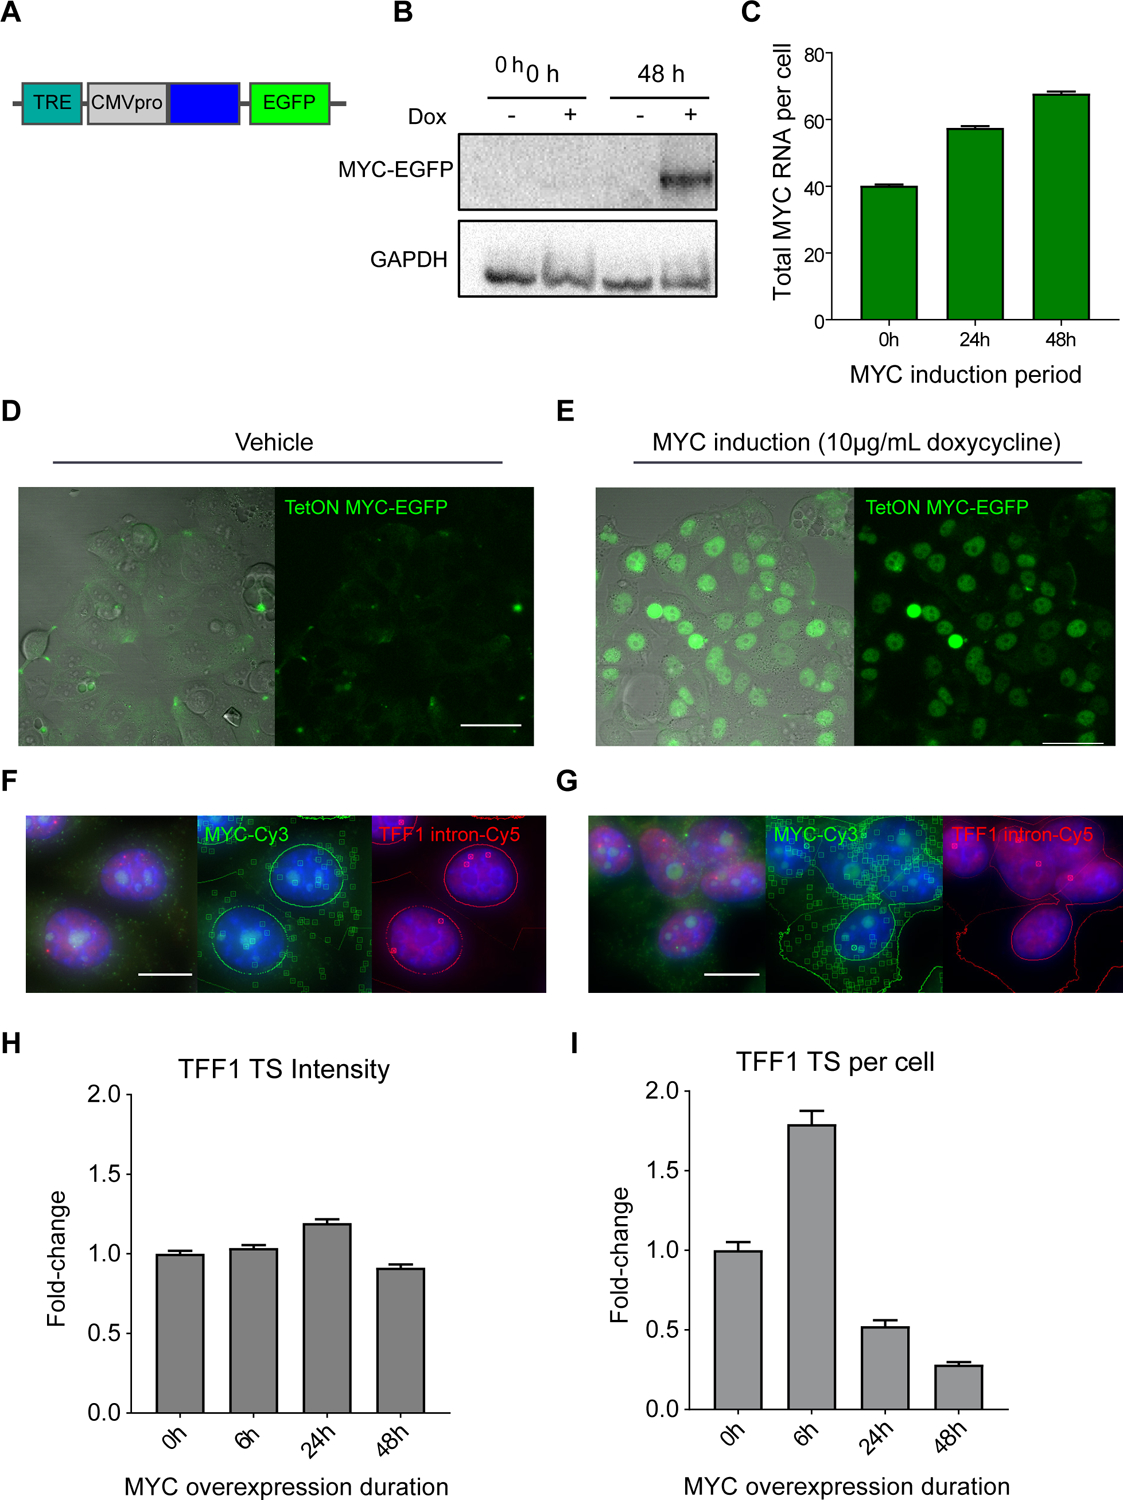
MYC overexpression increases number of nascent RNA at active TFF1 transcription sites.
(A) Schematic of TetON MYC-EGFP transgene, containing a doxycycline inducible Tet-responsive element and a CMV promoter driving expression of MYC-EGFP.
(B) MYC western blot of MCF7 TetON MYC-EGFP expression at 0 and 48 hours of vehicle or doxycycline induction.
(C) smFISH quantification of MYC RNA/cell with 0hrs (40.2 ± 0.4 RNA/cell, n=3448 cells), 24hrs (n=7890 cells), and 48hrs (67.7 ± 0.7 RNA/cell, n=6599 cells) of TetON MYC-EGFP induction with 10μg/mL doxycycline. Bars represent mean ± SEM.
(D) DIC-merged and fluorescence image of TetON MYC-EGFP expression induced with vehicle. Scale bar = 50μm.
(E) DIC-merged and fluorescence image of TetON MYC-EGFP expression induced with doxycycline. Scale as in (D).
(F) smFISH image of TetON MYC-EGFP expression induced with vehicle (blue=DAPI). RNA transcripts and transcription sites are identified with squares and circles, respectively. Scale bar = 12μm.
(G) smFISH image of TetON MYC-EGFP expression with doxycycline induction. RNA identification and scale as in (F).
(H) smFISH quantification of fold-change in fluorescence intensity (dox/vehicle, normalized to 0h) of TFF1 TS over a 48-hour time course of MYC-EGFP overexpression. Approximately 2000–6000 cells were imaged per condition.
(I) smFISH quantification of fold-change in TFF1 TS per cell (dox/vehicle, normalized to 0h) over a 48-hour time course of MYC-EGFP overexpression.
