
Figure 3.
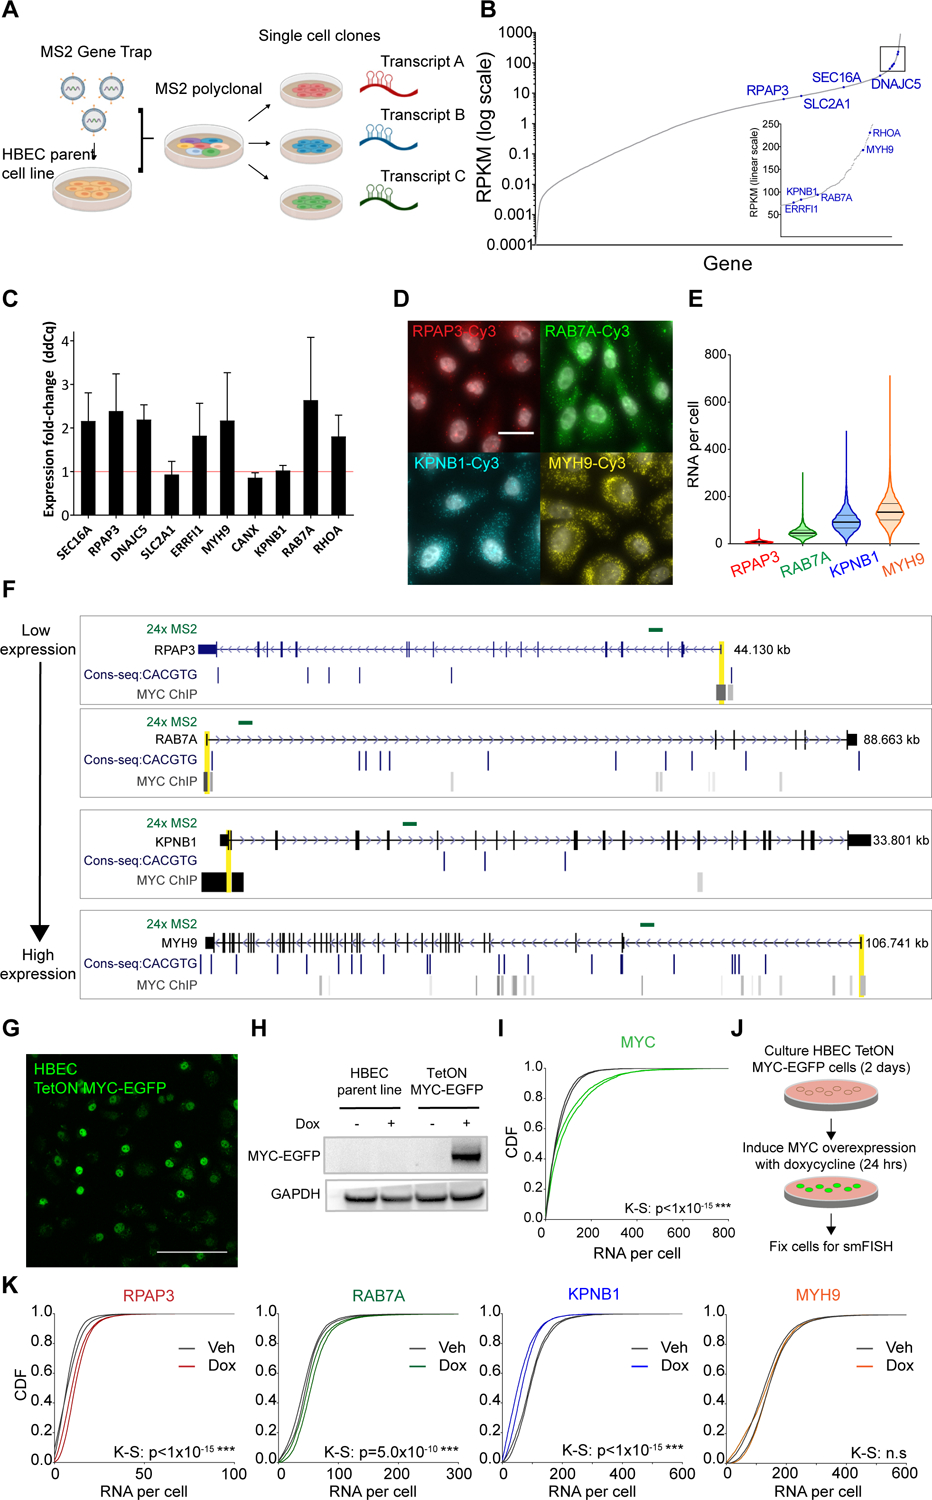
MYC perturbs genes with a range of function and basal expression level in the non-transformed human bronchial epithelial (HBEC) cell line.
(A) Schematic of the gene trap system developed by Wan et al. to insert MS2 stem loops globally into the introns of endogenous genes in the HBEC cell line.
(B) RNA expression profile of the HBEC transcriptome. Indicated in blue are the genes for which MS2 single-cell clones were generated.
(C) qPCR analysis of the effects of 24 hours transient MYC-mCherry overexpression on a panel of genes for which MS2 live cell clones are available. Expression is normalized to a control perturbation of mCherry plasmid.
(D) Representative smFISH images of RPAP3, RAB7A, KPNB1, and MYH9 RNA in HBEC cells in steady state culture (gray = DAPI). Scale bar = 20μm.
(E) Violin plot of distribution of RNA/cell of RPAP3 (n=5955 cells), RAB7A (n=4911 cells), KPNB1 (n=3511 cells), and MYH9 (n=7999 cells) in HBEC steady state culture. Black bar = median; gray bars = 25 and 75 percentiles.
(F) E-box consensus motifs and MYC ChIP-seq binding at four selected genes. Cell lines for which MYC binding at promoters was detected were GM12878, H1-hESC, HeLa, HUVEC, HepG2, K562, MCF7, MCF10A, and NB4. MS2 insertion locations for the single-cell clones are indicated in green. Promoter-proximal regions are indicated in yellow.
(G) Fluorescence image of TetON MYC-EGFP transgene stable expression in HBEC cells induced with 10μg/mL doxycycline for 24 hours. Scale bar = 70μm.
(H) MYC western blot of HBEC parent line and TetON MYC-EGFP stable line with 24 hours vehicle or doxycycline induction.
(I) Normalized CDF of MYC RNA abundance with vehicle or doxycycline induction of TetON MYC-EGFP. Two biological replicates per condition shown. K-S test performed on the replicates combined.
(J) Schematic of MYC overexpression experiment.
(K) Normalized CDF of MYH9, KPNB1, RAB7A, and RPAP3 RNA levels with vehicle and doxycycline induction of TetON MYC-EGFP. Two biological replicates per condition shown. Approximately 6000 cells were imaged on average per replicate. K-S test performed on the replicates combined.