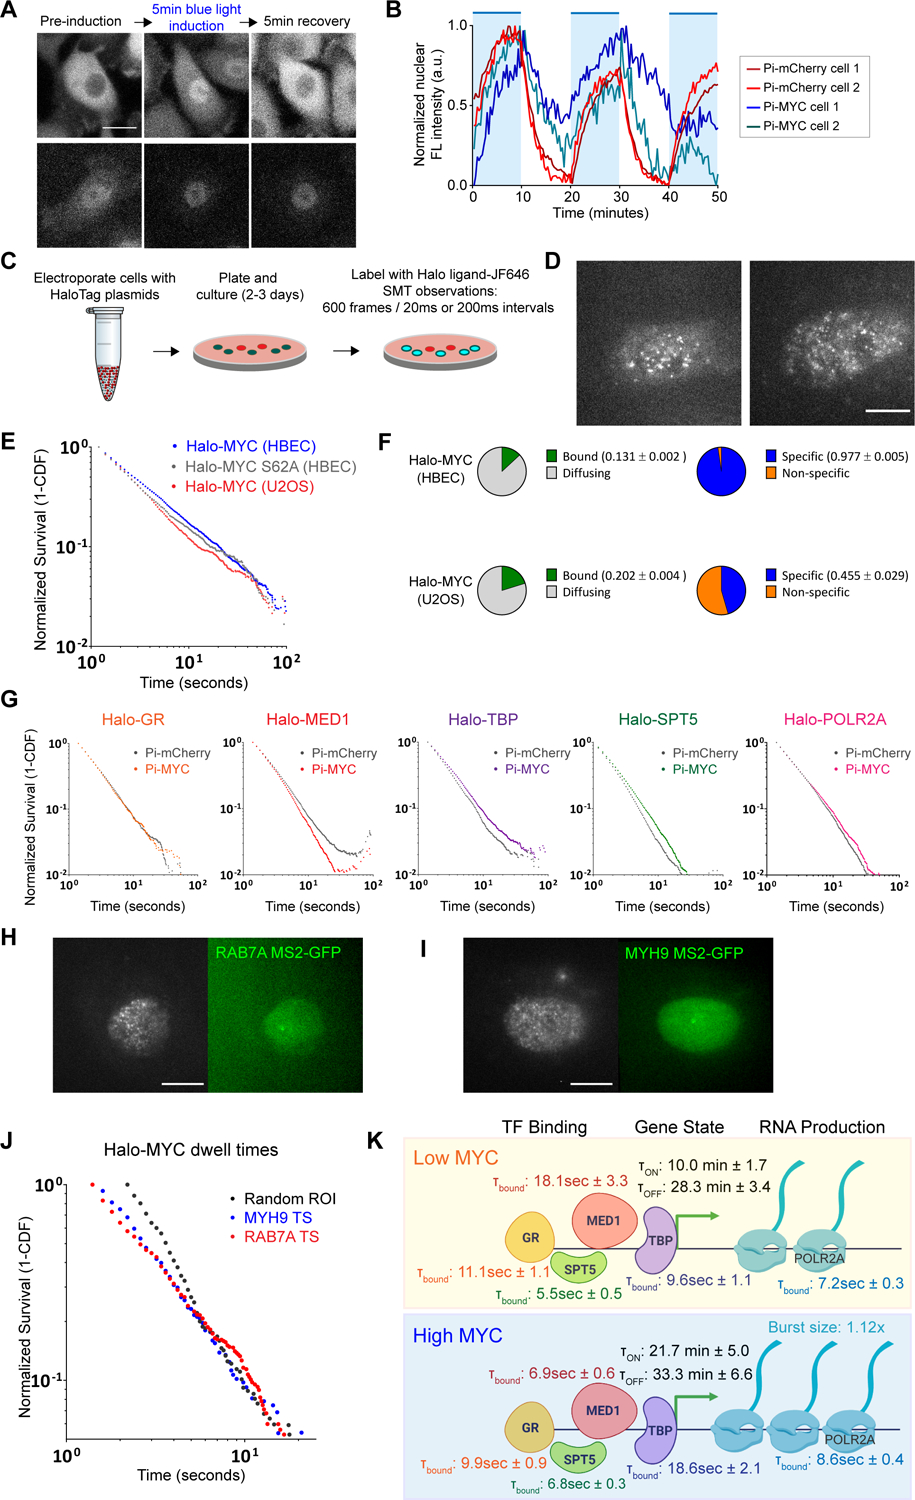
Figure 7.

MYC effects on residence time of basal transcription factors.
(A) Example fluorescence images comparing nuclear entry and exit between Pi-mCherry and Pi-MYC stably expressed in HBEC cells. Scale bar = 15μm.
(B) Quantification of nuclear fluorescence intensity over a one-hour time course of HBEC Pi-mCherry or Pi-MYC cells with repeated 10-minute periods of activating light (indicated by blue regions).
(C) Schematic representation of SMT experiments.
(D) Representative SMT images of Halo-MYC expressed in HBEC and U2OS. Scale bar = 10μm.
(E) Survival plot of Halo-MYC dwell times in HBEC (blue, n=33224 tracks) and U2OS (red, n=14845 tracks), and Halo-MYCS62A dwell times in HBEC (gray, n=18522 tracks).
(F) Fraction of Halo-MYC bound vs. diffusing population (green/gray) and specific vs. non-specific bound populations (blue/orange) in HBEC and U2OS.
(G) Survival plots of transcription factor dwell times with nuclear translocation of Pi-mCherry (GR=24662 tracks, MED1=66960 tracks, TBP=34205 tracks, SPT5=41957 tracks, POLR2A=50112 tracks) or Pi-MYC (GR=14666 tracks, MED1=30811 tracks, TBP=33008, SPT5=39618 tracks, POLR2A=49528 tracks).
(H) Representative images of dual-color SMT experiments tracking Halo-MYC in a cell actively transcribing RAB7A. Active TS indicated by white arrow. Scale bar = 10μm.
(I) As in (H), Halo-MYC tracked in a cell actively transcribing MYH9. Scale bar = 10μm.
(J) Survival plot comparing the dwell time distribution of Halo-MYC in HBEC nuclei at a random ROI (gray, n= 3361 tracks), MYH9 active TS (blue, n=1303 tracks), and RAB7A active TS (red, n=2304 tracks).
(K) Model of MYC mechanism of action. Rates and characteristic dwell times of transcription factor binding, gene ON/OFF states, and RNA production are from measurements taken in the HBEC MS2 polyclonal cell line.
