
Fig. 1 |. HR LEps coexpress KRT14 along with KRT19 resembling aged LEps.
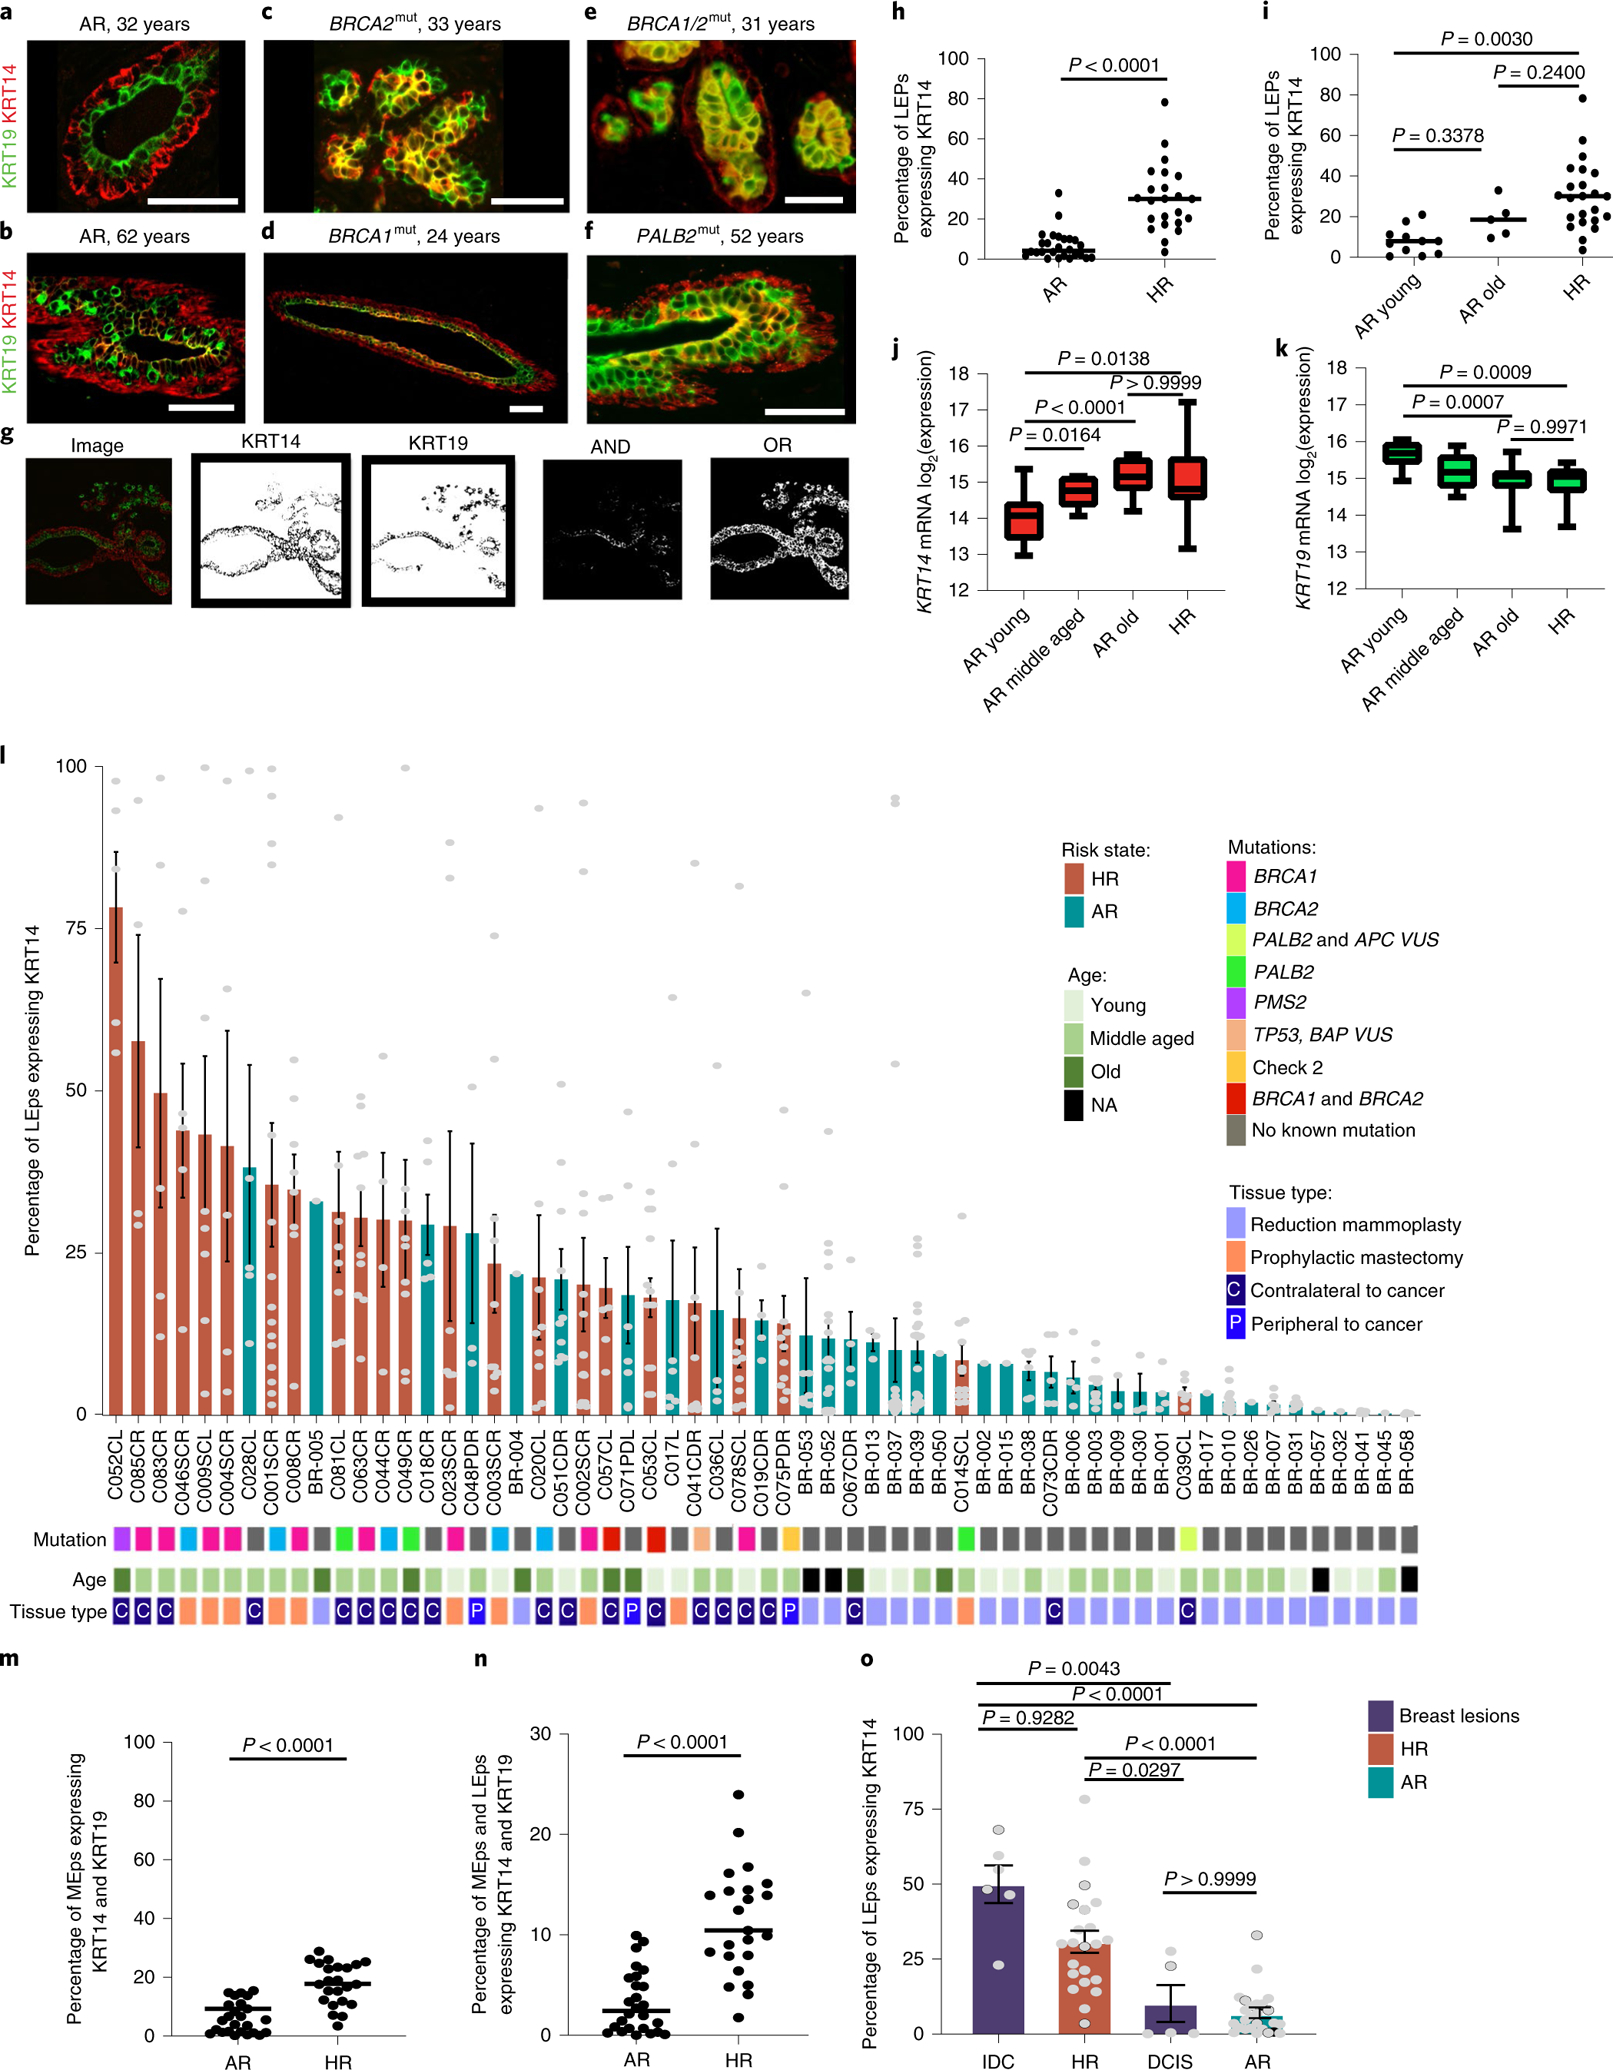
a–f, Immunofluorescent images of primary human mammary ducts stained for KRT19 (green) and KRT14 (red) from a 32-year-old AR woman (a), a 62-year-old AR woman (b), a 33-year-old woman harboring a BRCA2 mutation (BRCA2mut) (c), a 24-year-old woman harboring a BRCA1mut (d), a 31-year-old woman harboring BRCA1 and BRCA2 mutations (e) and a 52-year-old woman harboring a PALB2mut (f). Scale bars, 50 μm. g, A schematic of the method used in quantification and analysis of immunofluorescent images. h, Dot plot of the percentage of KRT19+ LEps expressing KRT14 in HR (n = 23) and AR (n = 26) samples. The P value was computed using a two-sided Mann–Whitney U-test. i, Dot plot of the percentage of KRT19+ LEps expressing KRT14 in HR (n = 23), AR younger (≤35 years, n = 11) and AR older (>55 years, n = 5) strains. The P values were computed using one-way ANOVA adjusted for multiple comparisons using Tukey’s post-hoc test. j,k, The log2(expression) of KRT14 (j) and KRT19 (k) mRNA in passage 4 LEps. The outlines of the boxes represent the first and third quartiles. The vertical line inside the boxes represents the median, and the whiskers go from each quartile to the minimum and maximum values. The P values were computed using Welch’s ANOVA test adjusted for multiple comparisons with Dunnett’s T3 post-hoc test. l, Waterfall plot of the percentage of KRT19+ LEps that express KRT14 in HR and AR strains mapped for mutation, age and tissue type. Age groups are as follows: young, ≤35 years; middle aged, >35 years and ≤55 years; and old, >55 years. m, Dot plot of the percentage of KRT14+ MEps expressing KRT19 fluorescent signal in HR and AR samples. n, Dot plot of the percentage of KRT19+ LEps and KRT14+ MEps expressing KRT14 and KRT19 in HR and AR samples detected by immunofluorescence. In m and n, the P values were computed using a two-sided Mann–Whitney U-test. o, Waterfall plot of the percentage of KRT19+ LEps that express KRT14 in all HR strains, all AR strains and tissue sections of premalignant and malignant breast lesions. The P values were computed using the Kruskal–Wallis test adjusted for multiple comparisons using Dunn’s post-hoc test. In l and o, the edges of the bars represent the means and the error bars represent the s.e.m. The gray dots in l represent data from each image taken per strain. The gray dots in o represent the average of images taken per strain/sample in the groups listed. At least two sections from each individual were stained and analyzed independently with similar results. The number of different individuals representing each group are as follows: a, 11; b, five; c, five; d, nine; e, two; f, three.