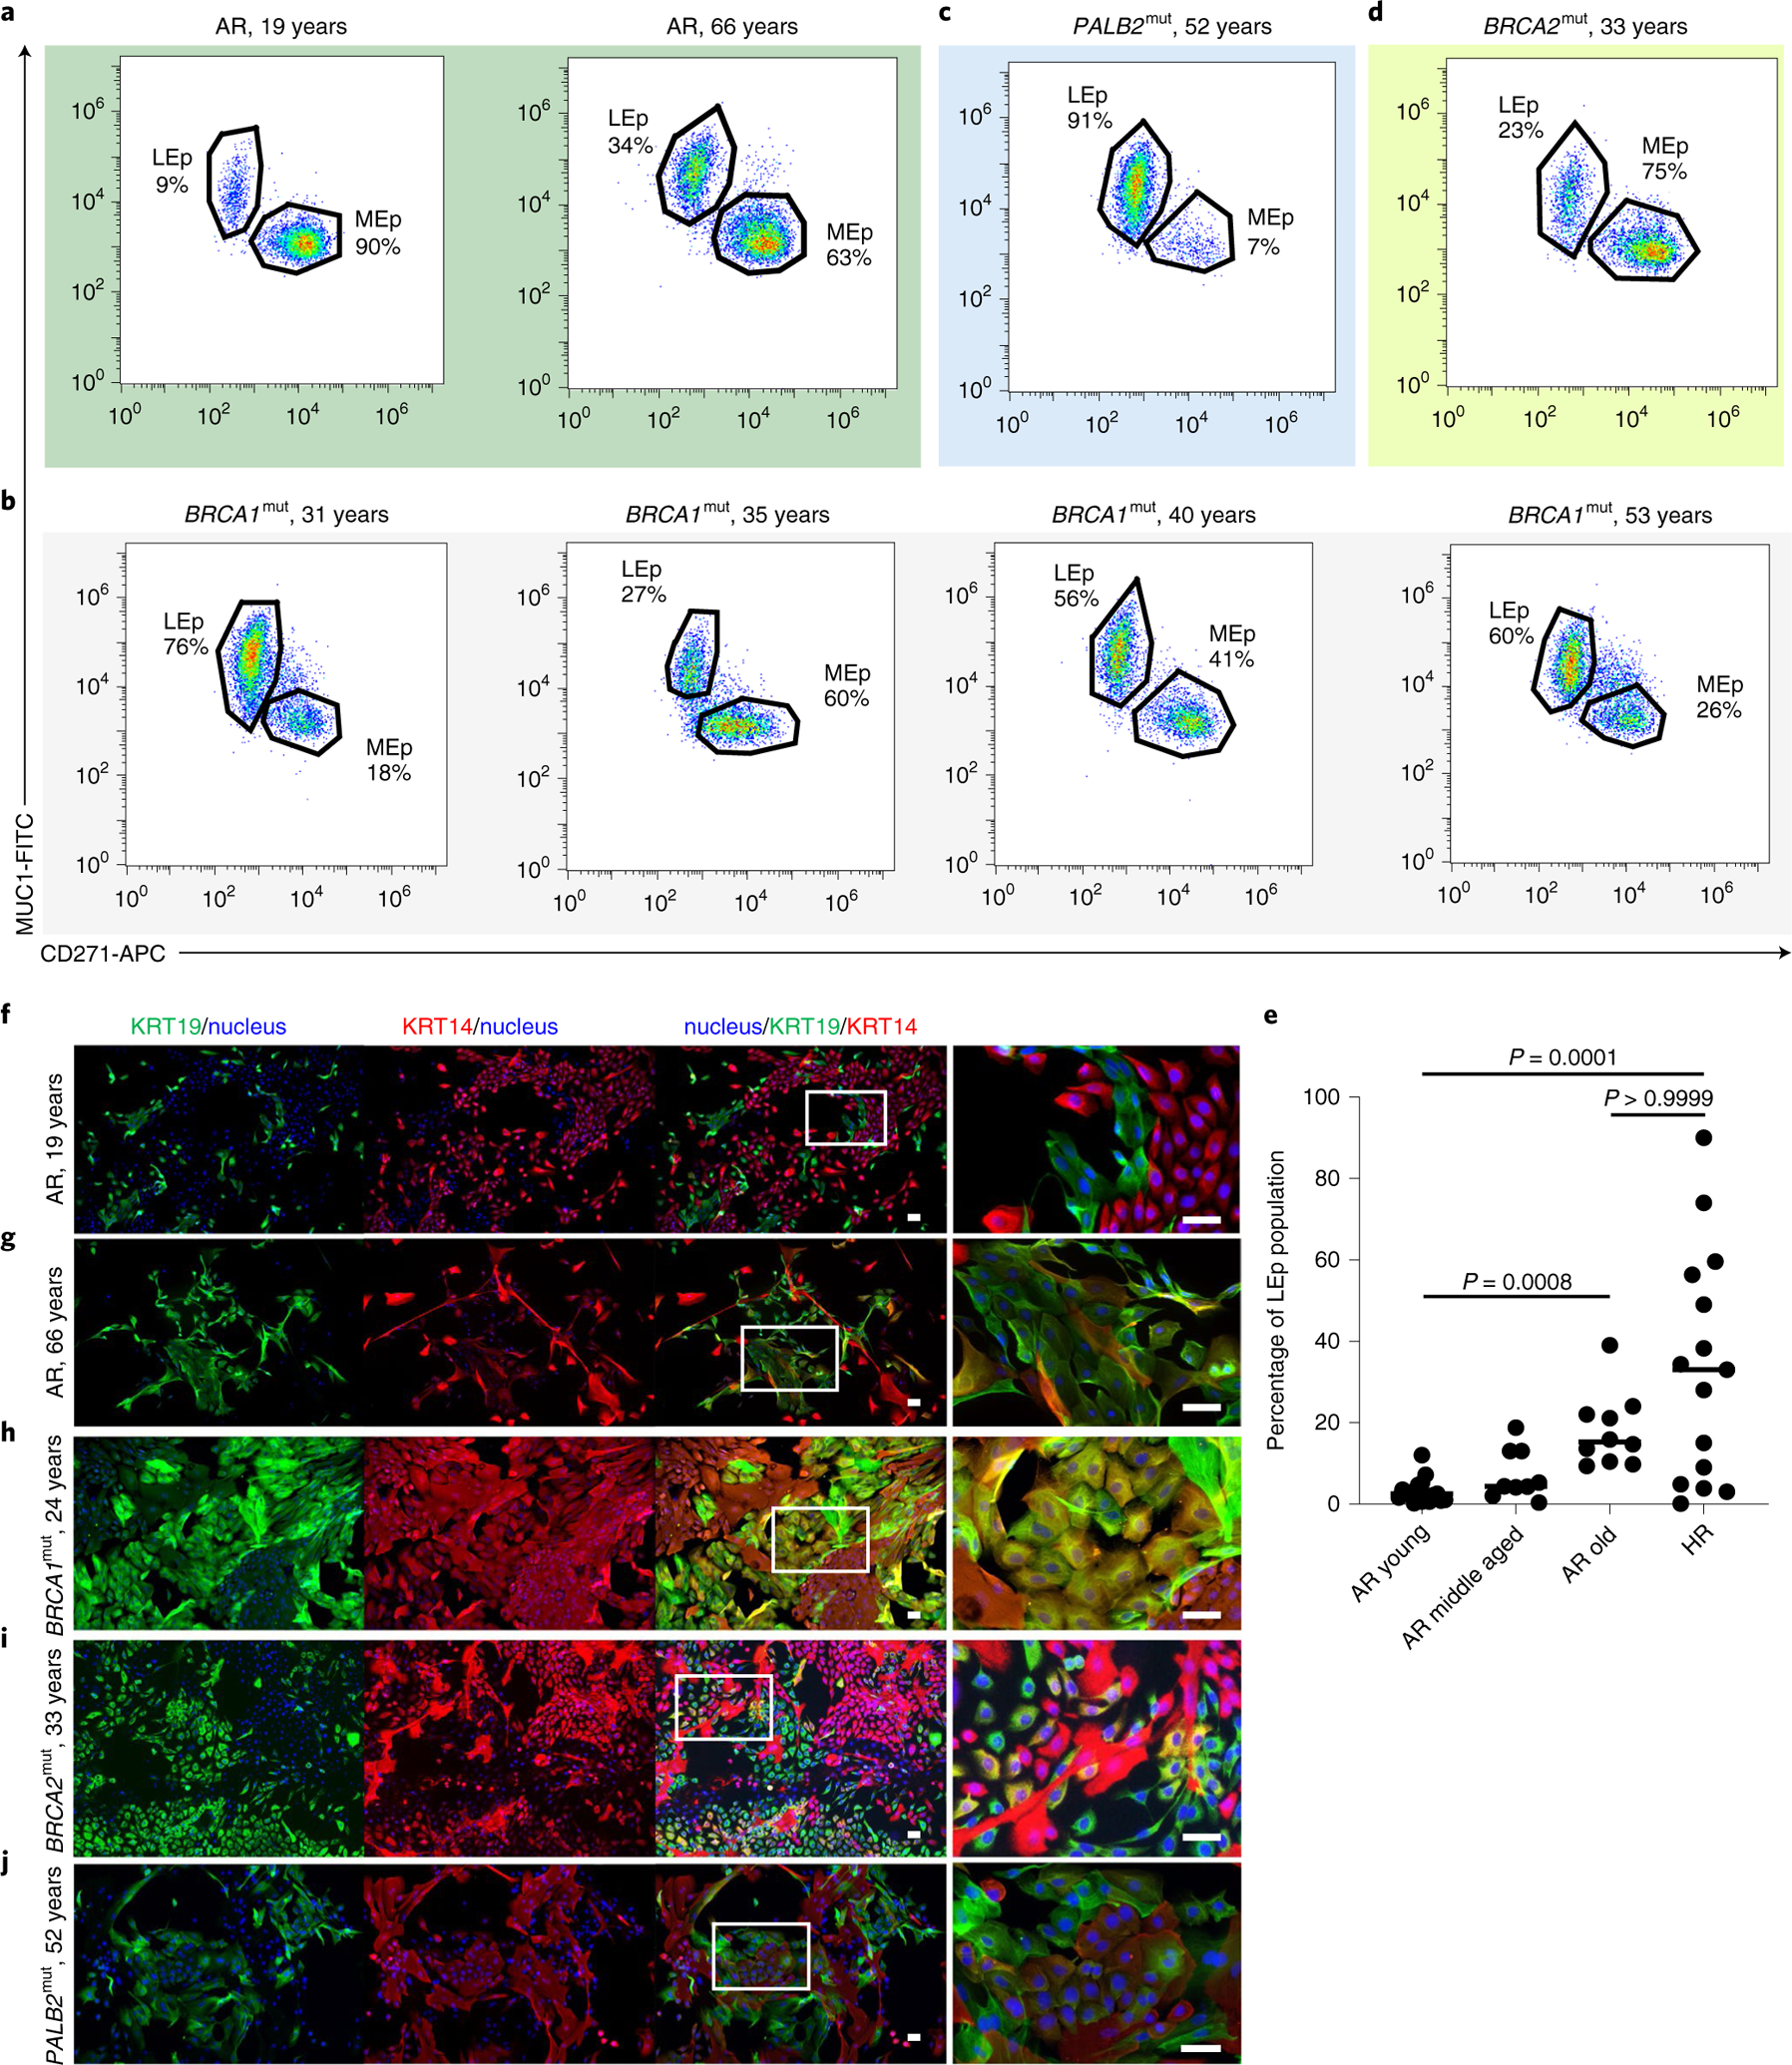
Fig. 2 |. HR cultured mammary epithelial cells show luminal expansion with a basal phenotype.

a–d, Flow cytometry analysis of passage 4 epithelia stained for CD271 and MUC1 from an AR 19-year-old woman and an AR 66-year-old woman (a), HR women of different ages (31, 35, 40 and 53 years) harboring BRCA1 mutations (b), an HR 52-year-old woman harboring a PALB2 mutation (PALB2mut) (c) and an HR 33-year-old woman harboring a BRCA2mut (d). e, Dot plot of the percentage of LEp populations from passage 4 epithelial strains derived from AR younger women (≤35 years, n = 17), AR middle-aged women (36–55 years, n = 9), AR older women (>55 years, n = 10) and HR women (n = 15). The median of each sample is indicated by a horizontal line. The P values were computed using the Kruskal–Wallis test adjusted for multiple comparisons with Dunn’s post-hoc test. f–j, Immunofluorescence staining of passage 4 cultured epithelial cells stained for KRT19 (green), KRT14 (red) and Hoechst (blue) from an AR 19-year-old woman (f), an AR 66-year-old woman (g), an HR 24-year-old woman harboring a BRCA1mut (h), an HR 33-year-old woman harboring a BRCA2mut (i) and a 52-year-old woman harboring a PALB2mut (j). The image on the right-hand side of each panel is a magnification of the area outlined by the white rectangle in the merged image. Scale bars, 50 μm. Experiments in f–j were repeated three times independently with similar results.
