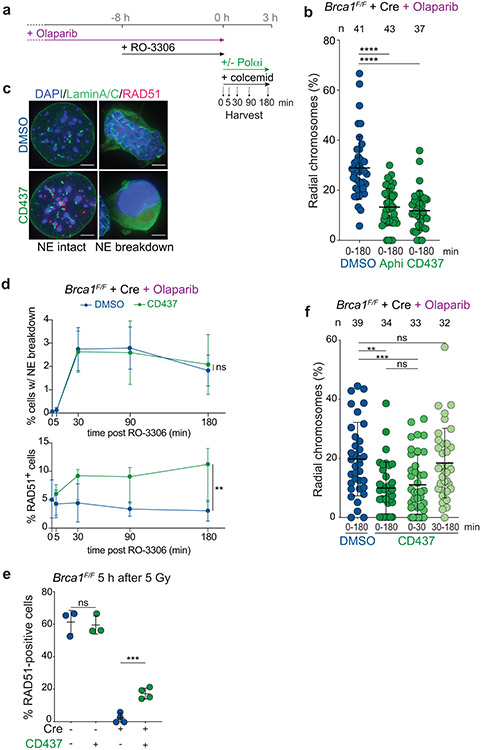
Extended Data Fig. 5. Fill-in synthesis occurs late in G2 in BRCA1-deficient cells.
a, Experimental timeline for Polα inhibition in PARPi-treated, BRCA1-deficient MEFs released from G2 into prolonged (180 min) metaphase arrest. b, Quantification of the percent of chromosomes involved in radial structures. Number of metaphases (n, each represented by a dot) pooled from three independent experiments is indicated. c, Representative sample images of nuclei with intact or broken-down nuclear envelopes (NE) as assessed by Lamin A/C IF. Scale bars, 5 μm. d, Top, analysis of NE breakdown timing after release from G2 in cells as in a and c assessed at the indicated time points. Bottom, analysis of RAD51 foci formation in the same population of cells. Data from three independent experiments. For NE breakdown, Lamin A/C integrity was visually assessed in at least 800 cells per condition per experiment. For RAD51 foci formation, 50-136 nuclei were analyzed per condition per experiment. e, Quantification of RAD51-positive nuclei in Brca1F/F MEFs following treatment with Cre and IR. n = three (no Cre) or four (+ Cre) independent experiments. f, Quantification of percent of chromosomes involved in radial structures after the indicated treatment. Number of metaphases (n, each represented by a dot) pooled from four independent experiments is indicated. Statistical analyses as in Fig. 1. All means are indicated with center bars and SDs with error bars.

